Fig. 9
Download original image
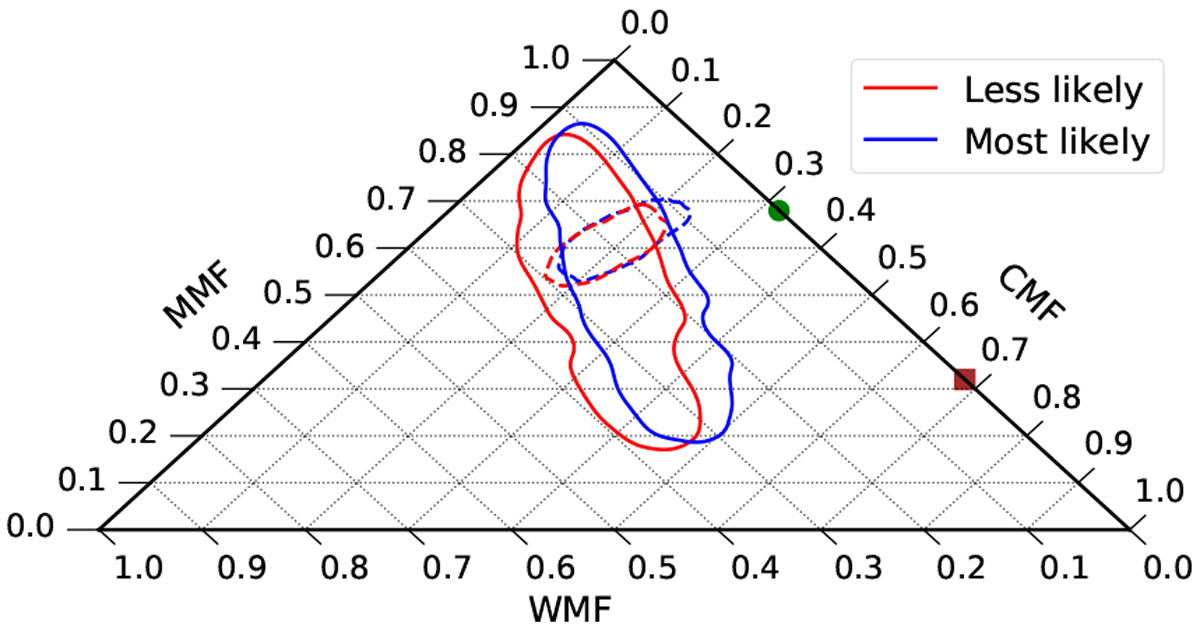
2D 1σ confidence regions of HD 207897 b for the mass estimation with activity period on 37.6 d (blue) and with activity period on 35.9 d (red). Solid lines indicate the confidence intervals of scenario 1, and dashed lines correspond to scenario 2, in which the stellar abundances are also included as input data in the MCMC interior structure analysis. The MMF is defined as MMF = 1 - CMF - WMF. The green dot and brown square indicate the position of Earth and Mercury in the ternary diagram, respectively.
Current usage metrics show cumulative count of Article Views (full-text article views including HTML views, PDF and ePub downloads, according to the available data) and Abstracts Views on Vision4Press platform.
Data correspond to usage on the plateform after 2015. The current usage metrics is available 48-96 hours after online publication and is updated daily on week days.
Initial download of the metrics may take a while.