Fig. 5
Download original image
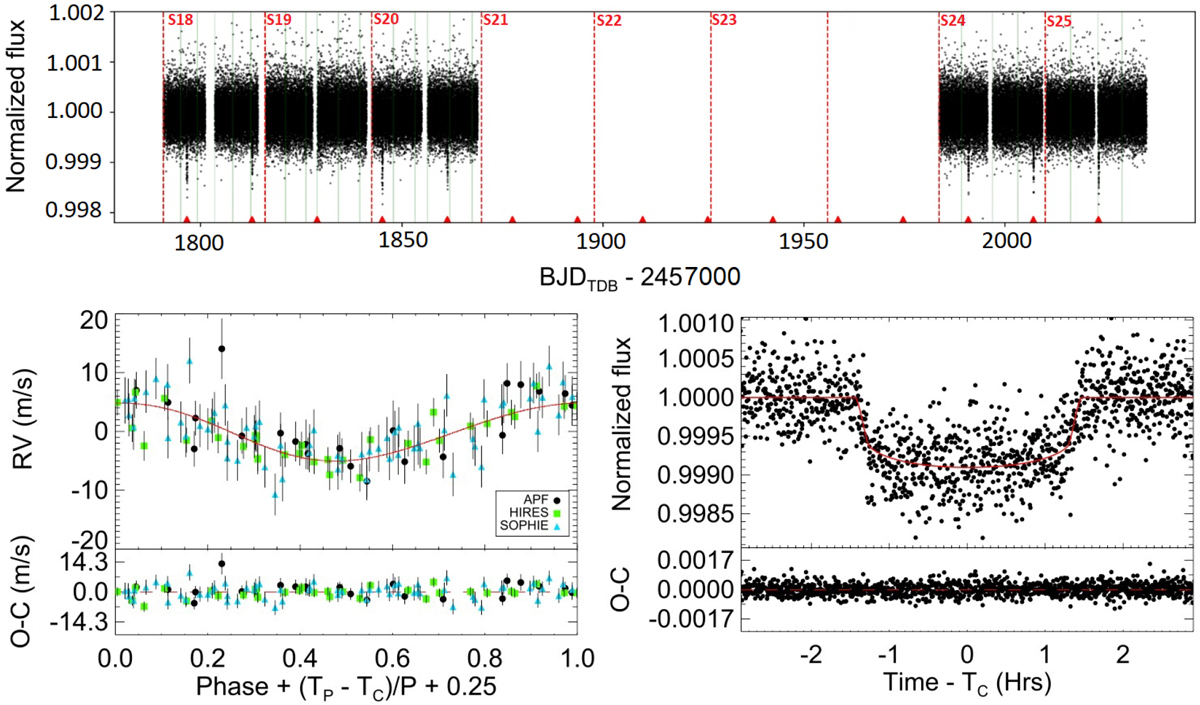
TESS light curves and EXOFASTv2 best-fit models for RVs and phometric data. Top panel: full PDC-SAP (two-minute) TESS light curve after detrending, taken from sectors 18, 19, 20, 25, and 26. The red triangles indicate the transit events, and the green vertical lines indicate the momentum dumps of the spacecraft, which occur every 2.5 days. None of the transit events occurred during momentum dumps. Bottom left: phase-folded SOPHIE, APF, and HIRES RVs of HD 207897 b at the period of 16.20 d. Bottom right: TESS phase-folded light curve.
Current usage metrics show cumulative count of Article Views (full-text article views including HTML views, PDF and ePub downloads, according to the available data) and Abstracts Views on Vision4Press platform.
Data correspond to usage on the plateform after 2015. The current usage metrics is available 48-96 hours after online publication and is updated daily on week days.
Initial download of the metrics may take a while.