Fig. B.2
Download original image
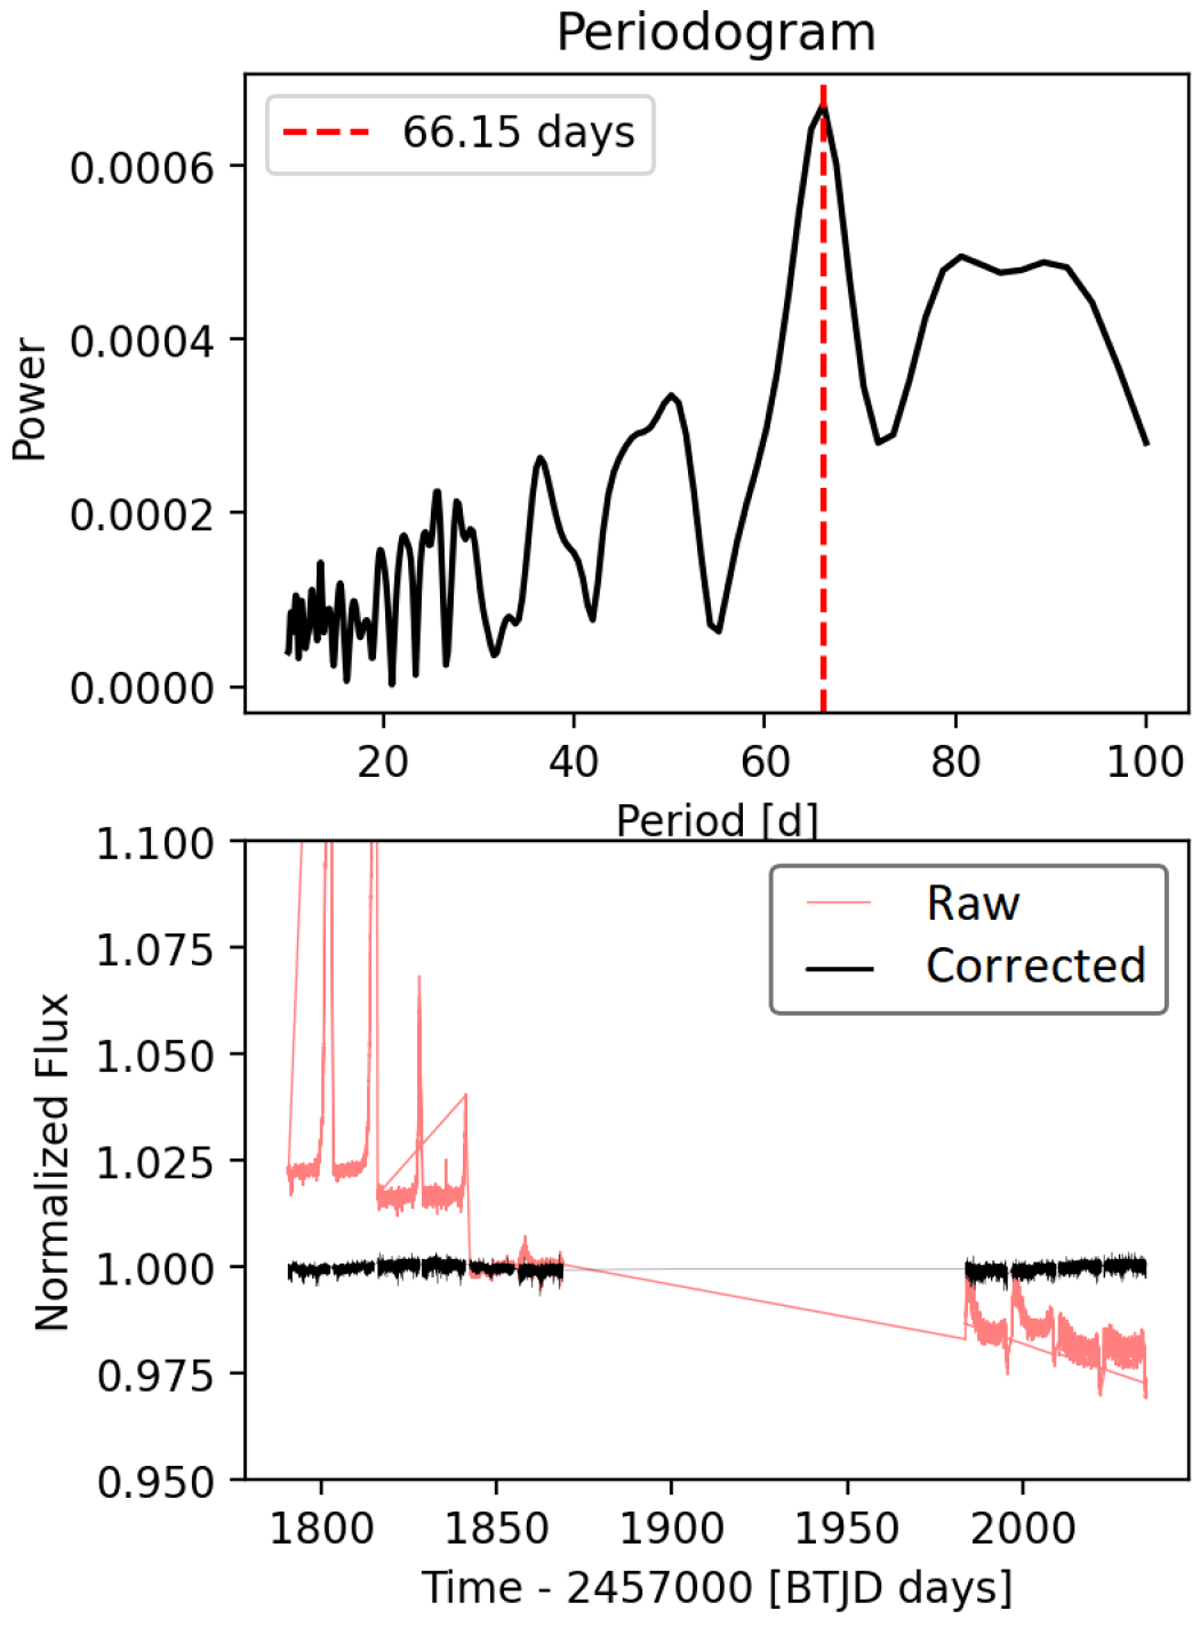
Systematics-insensitive periodogram and SAP TESS data for HD207897. Top: The SIP periodogram is generated for HD207897. Bottom: Raw SAP TESS light curves in red and detrended data against instrument systematics by SIP in black. The SIP periodogram does not exhibit any significant signal for HD207897 b because the highest peak in this periodogram has a power of only 0.0006 at 66.6 d.
Current usage metrics show cumulative count of Article Views (full-text article views including HTML views, PDF and ePub downloads, according to the available data) and Abstracts Views on Vision4Press platform.
Data correspond to usage on the plateform after 2015. The current usage metrics is available 48-96 hours after online publication and is updated daily on week days.
Initial download of the metrics may take a while.