Fig. 1
Download original image
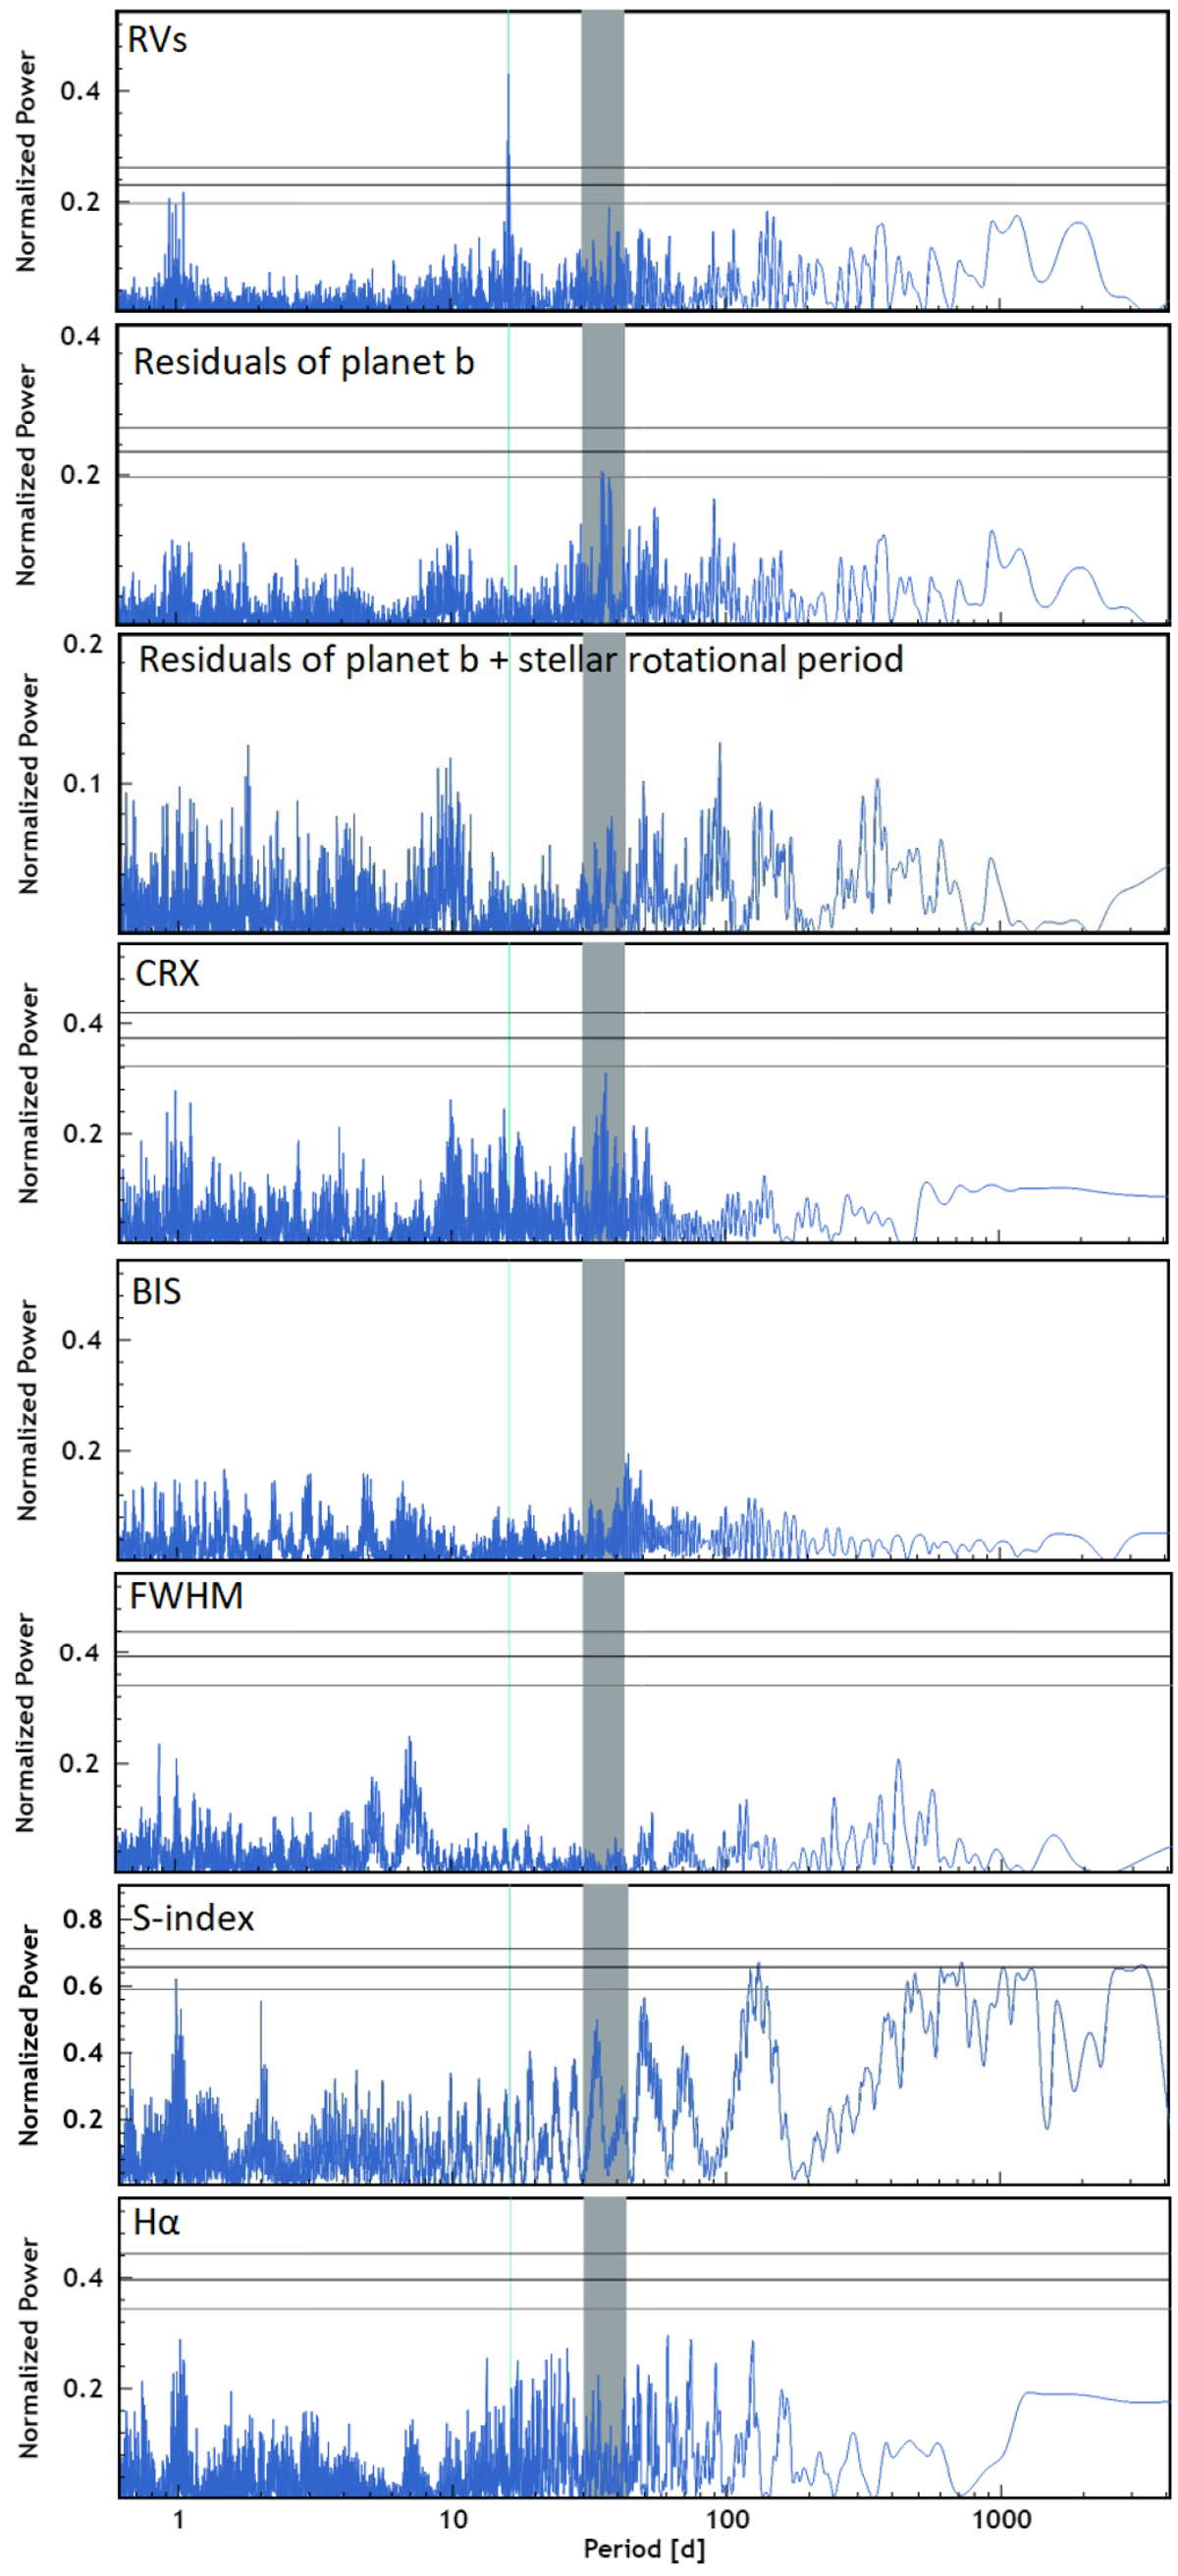
Normalized periodograms of RVs and activity indexes for HD 207897. From top to bottom: RVs, residual of RVs after a Keplerian fit on 16.20 d, residuals of the fit on the planet and stellar rotation signal, CRX, bisector, FWHM, and Hα index. Thevertical cyan line marks the position of the highest peak in the RV periodogram at 16.20 d and shows no corresponding peak in the stellar activity periodograms. Horizontal lines indicate the 0.1, 1, and 10% FAP level from top to bottom. The vertical gray strip highlights the position of the rotational stellar period as estimated in Sect. 3.3.2.
Current usage metrics show cumulative count of Article Views (full-text article views including HTML views, PDF and ePub downloads, according to the available data) and Abstracts Views on Vision4Press platform.
Data correspond to usage on the plateform after 2015. The current usage metrics is available 48-96 hours after online publication and is updated daily on week days.
Initial download of the metrics may take a while.