Fig. 8
Download original image
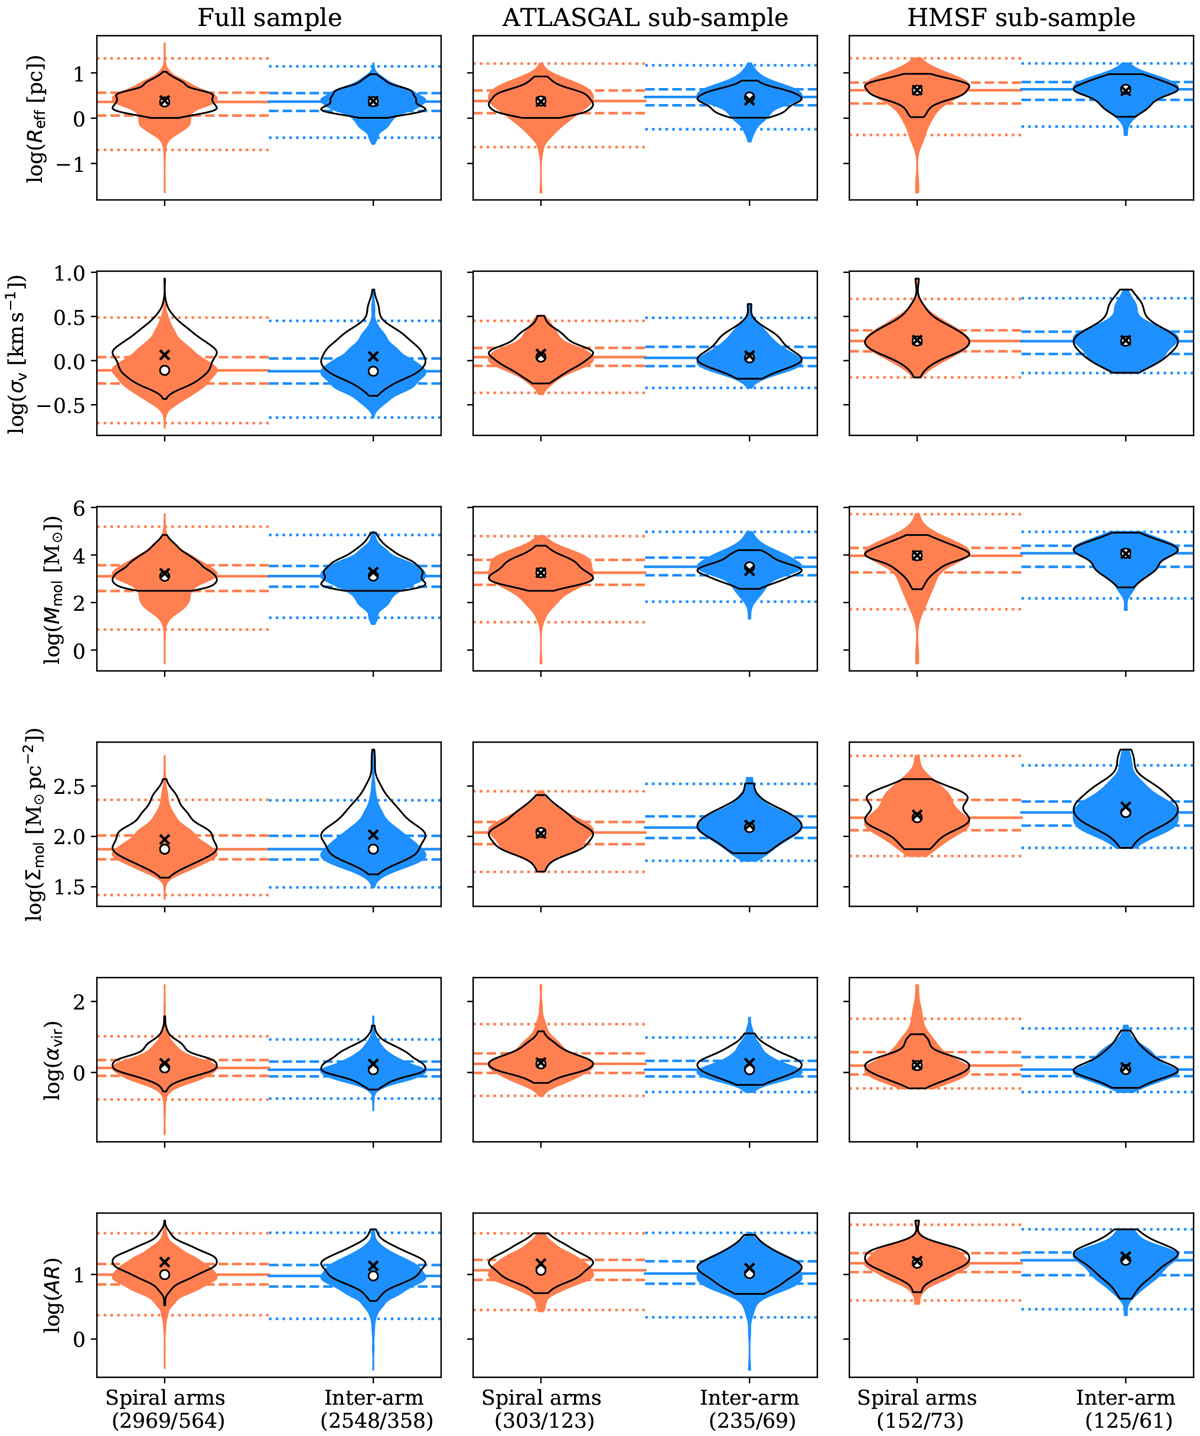
Distributions of the cloud properties in the spiral arms (red) and in the inter-arm regions (blue) drawn from the science sample and represented as violin plots (which show the relative shape of the distributions). The violins outlined in black show the distributions drawn from the complete distance-limited sample. From top to bottom rows: effective radius, velocity dispersion, molecular gas mass, molecular gas mass surface density, virial parameter, and aspect ratio, for the full (science or complete distance-limited) sample of clouds, clouds with an ATLASGAL source, and clouds with an HMSF signpost (from left to right). The full horizontal line showsthe distribution medians of the science sample. The dashed lines display the position of the Q25 = 25th and Q75 = 75th percentiles. The dotted lines indicate the position of the lower and upper whiskers (defined as Q25 − 1.5 IQR and Q75 + 1.5 IQR, respectively, where the interquartile range IQR = Q75 − Q25). The horizontal lines have the same colours as the associated violin diagram. In the violins, the white circle indicates the median of the distribution from the science sample while the cross shows the median for the complete distance-limited sample. In the x-axis labels, for each environment (spiral-arms and inter-arm regions), the two numbers within the brackets indicate the number of clouds in the science sample and in the complete distance-limited sample, respectively.
Current usage metrics show cumulative count of Article Views (full-text article views including HTML views, PDF and ePub downloads, according to the available data) and Abstracts Views on Vision4Press platform.
Data correspond to usage on the plateform after 2015. The current usage metrics is available 48-96 hours after online publication and is updated daily on week days.
Initial download of the metrics may take a while.