Fig. 6
Download original image
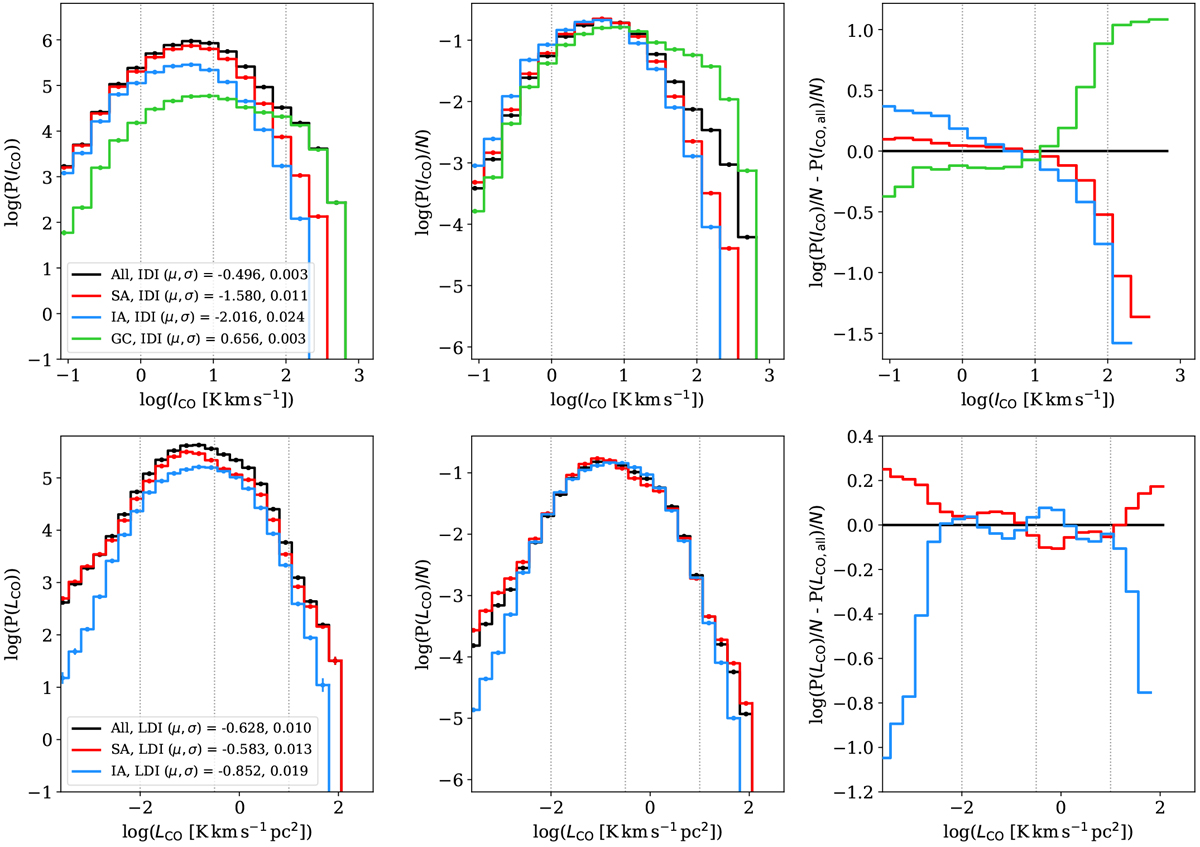
Top left: probability distribution functions (PDFs) of the integrated intensity emission for the full integrated intensity map (black), within the spiral arms (red), for inter-arm regions (blue), and towards the Galactic centre (green). Top middle: PDFs normalised by the total counts (N) in the distribution. Top right: relative value of the normalised PDFs of each region with respect to the normalisedtotal distribution (named ‘All’ in the left panel). In the top-left panel legend, IDI median (μ) and median absolute deviation (σ) are shown for each region (where SA, IA, and GC stand for spiral arms, inter-arm region, and Galactic centre, respectively). The IDI thresholds are indicated with grey vertical dotted lines. Bottom row: parallel distribution representations using CO luminosity from clouds. Statistics for the LDI from each considered region are indicated in the bottom-left panel legend.
Current usage metrics show cumulative count of Article Views (full-text article views including HTML views, PDF and ePub downloads, according to the available data) and Abstracts Views on Vision4Press platform.
Data correspond to usage on the plateform after 2015. The current usage metrics is available 48-96 hours after online publication and is updated daily on week days.
Initial download of the metrics may take a while.