Fig. 5
Download original image
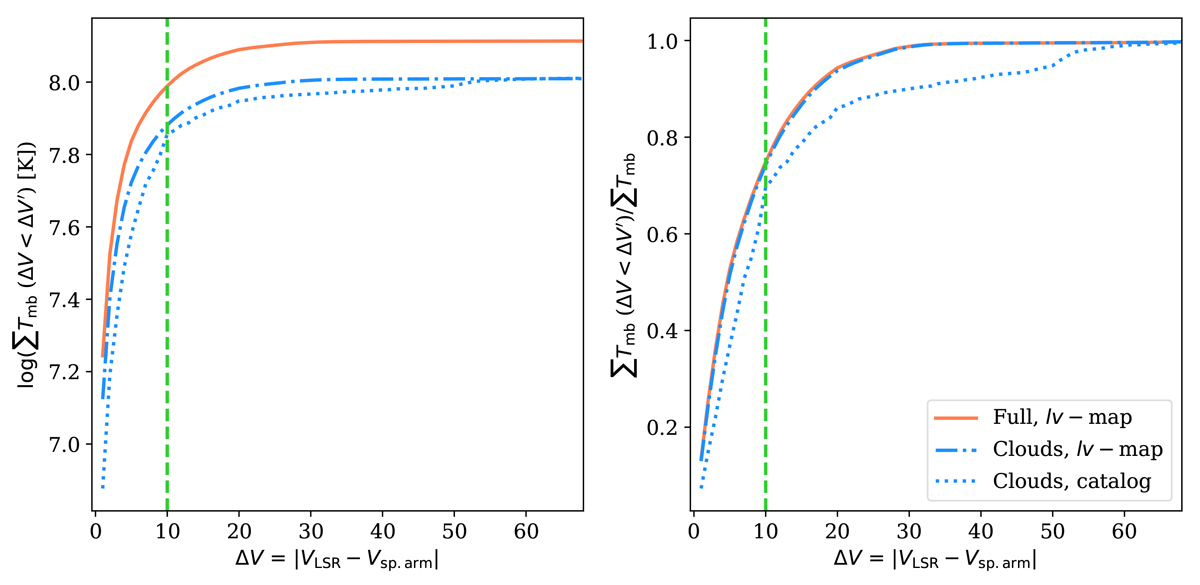
Cumulative distribution of the integrated intensity of the velocity offsets with respect to spiral arms (ΔV; left) and cumulative distribution normalised by the total flux in their respective datasets (right). In the panels, we show cumulative distribution from the different methods described in the text: direct integration of the original lv−map data cube (orange full line), integration of the lv−map generated by cloud masks (blue dotted-dashed line), integration of the cloud fluxes as per their cloud velocity centroid association to the closest spiral arm (blue dotted lines). The dashed green line shows the 10 km s−1 width used to define arm association.
Current usage metrics show cumulative count of Article Views (full-text article views including HTML views, PDF and ePub downloads, according to the available data) and Abstracts Views on Vision4Press platform.
Data correspond to usage on the plateform after 2015. The current usage metrics is available 48-96 hours after online publication and is updated daily on week days.
Initial download of the metrics may take a while.