Fig. B.1
Download original image
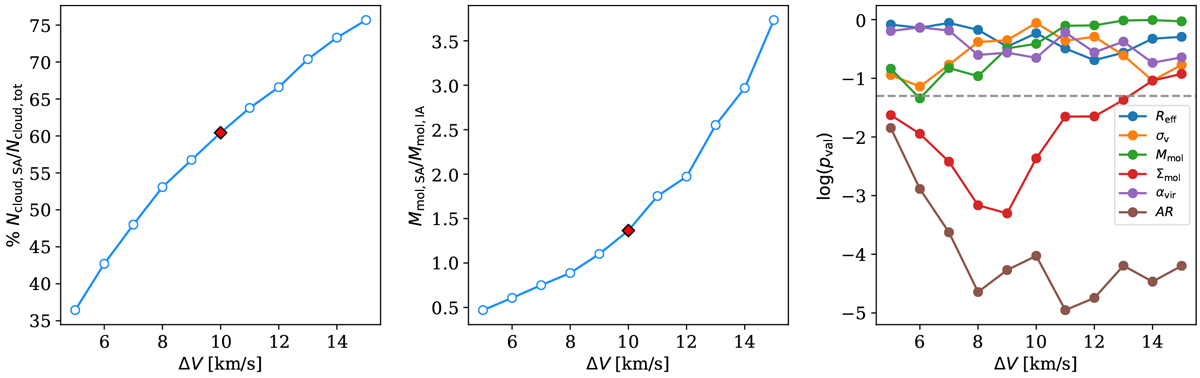
Number of clouds in the spiral arms (Ncloud, SA) as a percentage of the total number of clouds (Ncloud, tot) in the complete distance-limited sample (left panel), and the integrated cloud mass within spiral arms (Mmol, SA) over integrated cloud mass within the inter-arm region (Mmol, IA; middle panel) versus different velocity offsets with respect to the spiral arm model ridge line. In the panels, the red diamonds show the values for our chosen velocity offset ΔV = 10 km s−1. Also shown is the KS test p−value (pval, right panel) variation with respect to ΔV calculated from the property distributions of the clouds in the spiral arms and inter-arm region. Considered properties are effective radius Reff, velocity dispersion σv, molecular gas mass Mmol, molecular gas mass surface density Σmol, virial parameter αvir, and aspect ratio AR. The dashed line indicates p−value = 0.05.
Current usage metrics show cumulative count of Article Views (full-text article views including HTML views, PDF and ePub downloads, according to the available data) and Abstracts Views on Vision4Press platform.
Data correspond to usage on the plateform after 2015. The current usage metrics is available 48-96 hours after online publication and is updated daily on week days.
Initial download of the metrics may take a while.