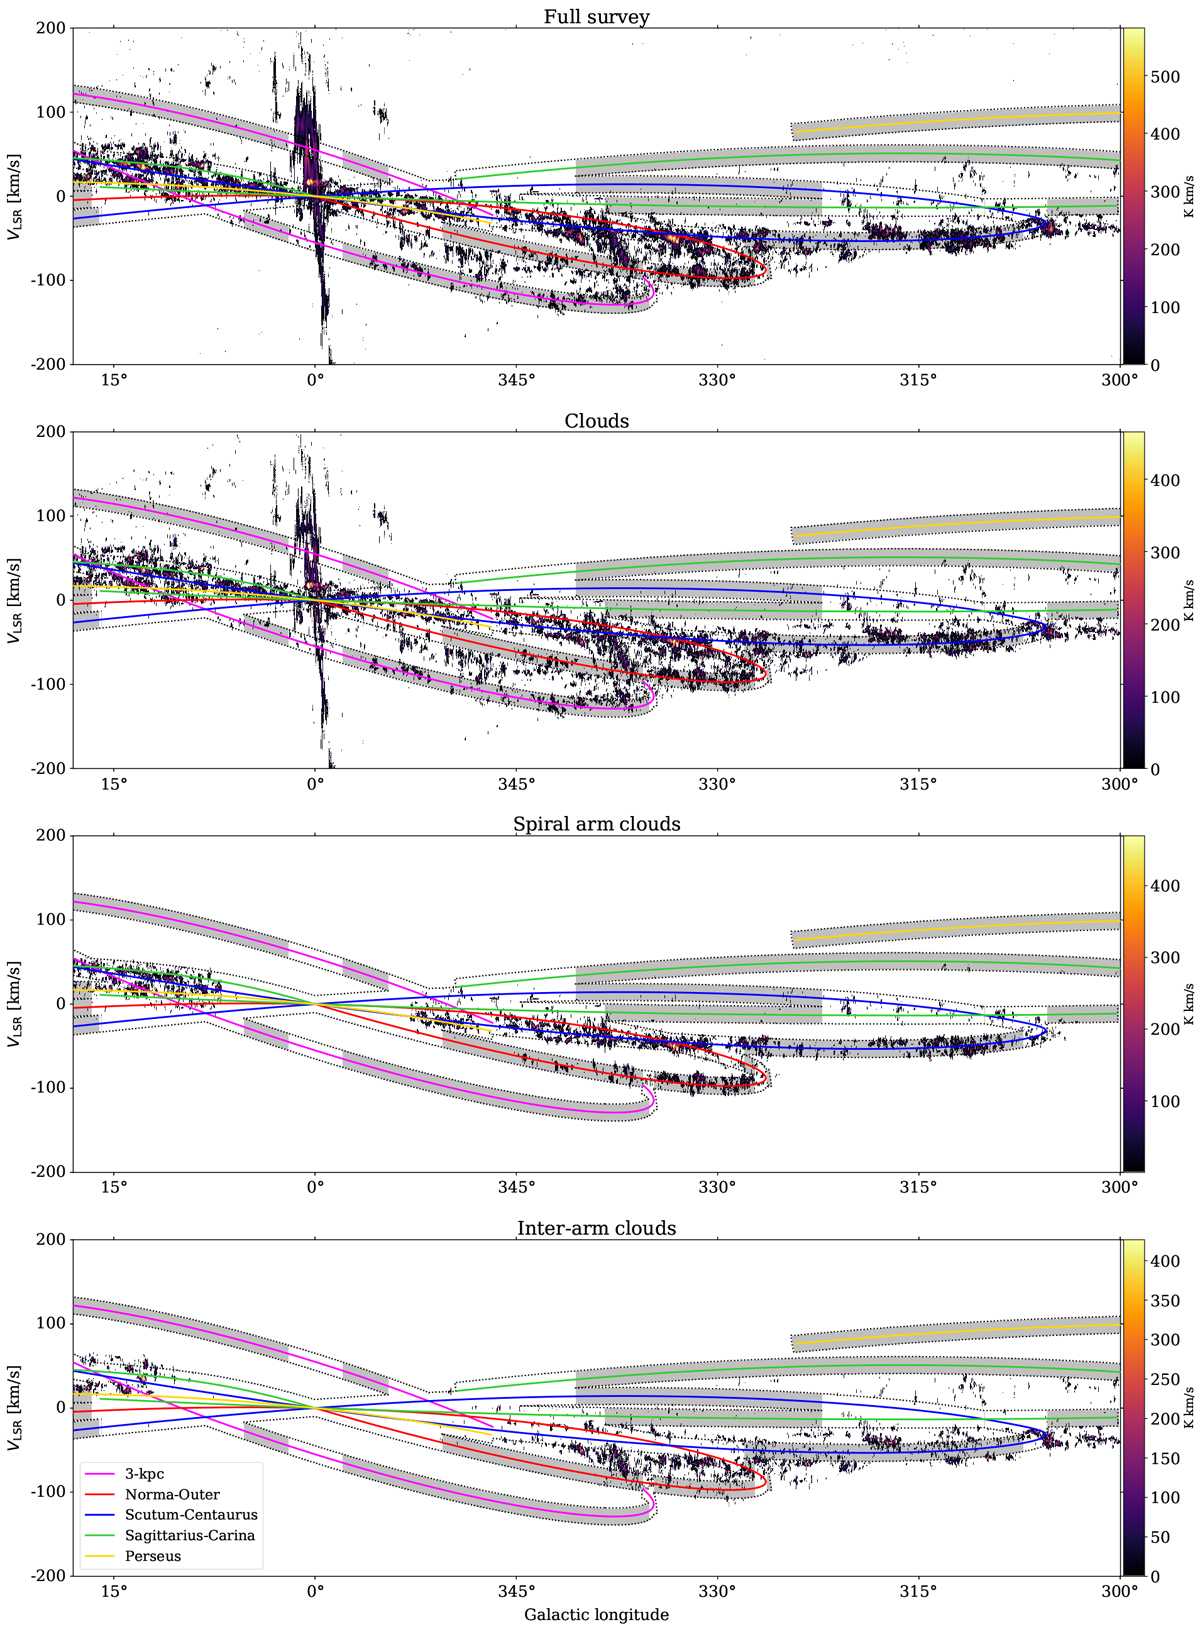
Fig. 1
Download original image
From top to bottom: longitude–velocity map (lv-map) from the trunk-masked full survey data cube (see Sect. 2), the cloud data cube, the data cube obtained for the clouds located in the spiral arms, and the data cube obtained for the clouds located in the inter-arms (following the CxyA method described in Sect. 4.2.2). In each panel, the spiral arm tracks defined by Taylor & Cordes (1993) are overlaid: the 3 kpc arms in magenta, the Norma-Outer arm in red, the Scutum-Centaurus arm in blue, the Sagittarius-Carina arm in green, and the Perseus arm in yellow. Dotted black lines surround areas of the lv−map that have a velocity offset with respect to the spiral arms within 10 km s−1. Shaded patches indicate regions along the spiral arms where the velocity difference between adjacent arms (along the velocity axis) is greater than 20 km s−1. In the last two panels, the clouds associated with the 3 kpc arms and the clouds with unreliable distance are excluded as they cannot be unequivocally associated with a spiral arm or inter-arm region (see Sect. 4.2.2).
Current usage metrics show cumulative count of Article Views (full-text article views including HTML views, PDF and ePub downloads, according to the available data) and Abstracts Views on Vision4Press platform.
Data correspond to usage on the plateform after 2015. The current usage metrics is available 48-96 hours after online publication and is updated daily on week days.
Initial download of the metrics may take a while.