Fig. 8.
Download original image
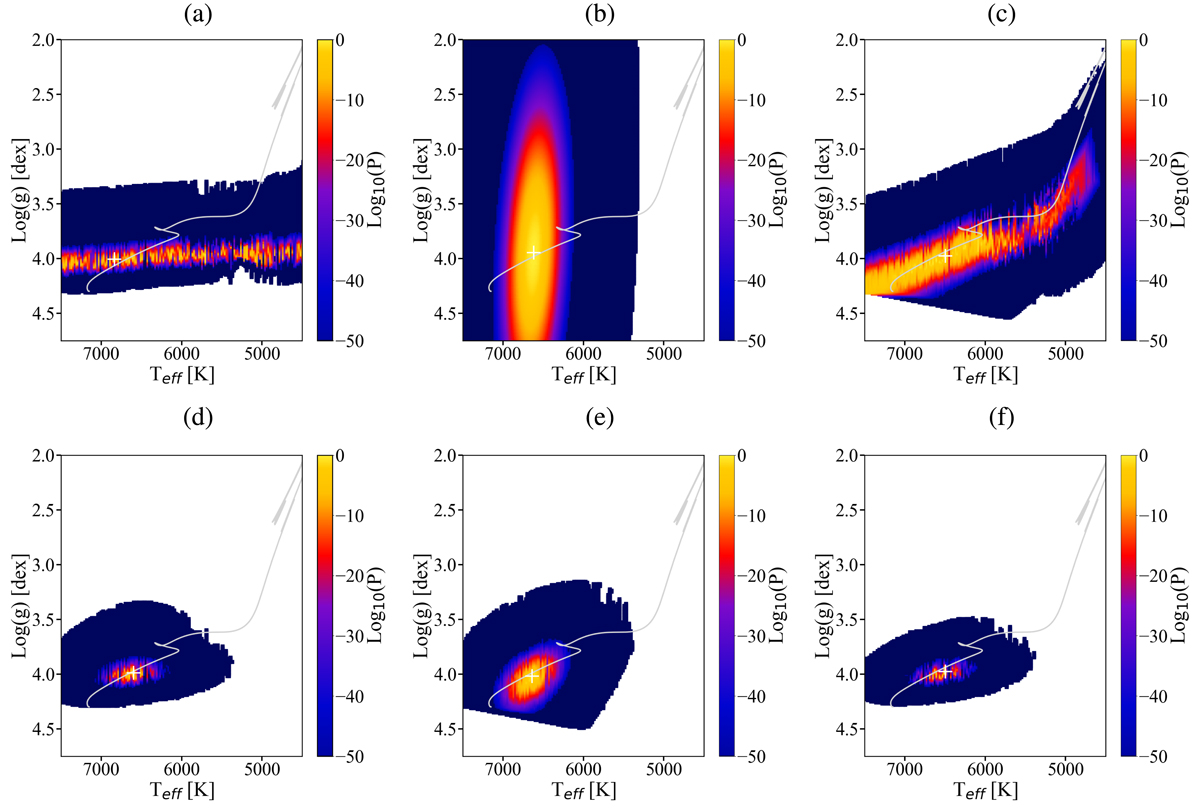
Six PDFs calculated for Procyon from different modes of SAPP: (a) asteroseismology, (b) spectroscopy, (c) photometry and parallax, (d) spectroscopy and asteroseismology (this is analogue to our constrained spectroscopy + νmax prior results described in Sect. 4.1), (e) spectroscopy and photometry (with parallax), and (f) combined (Bayesian scheme). The horizontal axis is effective temperature, the vertical axes is surface gravity, and the colour bar is the logarithm of probability. Each PDF is sliced in the [Fe/H] dimension. The grey solid line represents a stellar evolution track with 1.5 M⊙ and Z = Z⊙ (the pre-main sequence is not included). The white cross represents the best-fit value for the given PDF.
Current usage metrics show cumulative count of Article Views (full-text article views including HTML views, PDF and ePub downloads, according to the available data) and Abstracts Views on Vision4Press platform.
Data correspond to usage on the plateform after 2015. The current usage metrics is available 48-96 hours after online publication and is updated daily on week days.
Initial download of the metrics may take a while.