Fig. 7.
Download original image
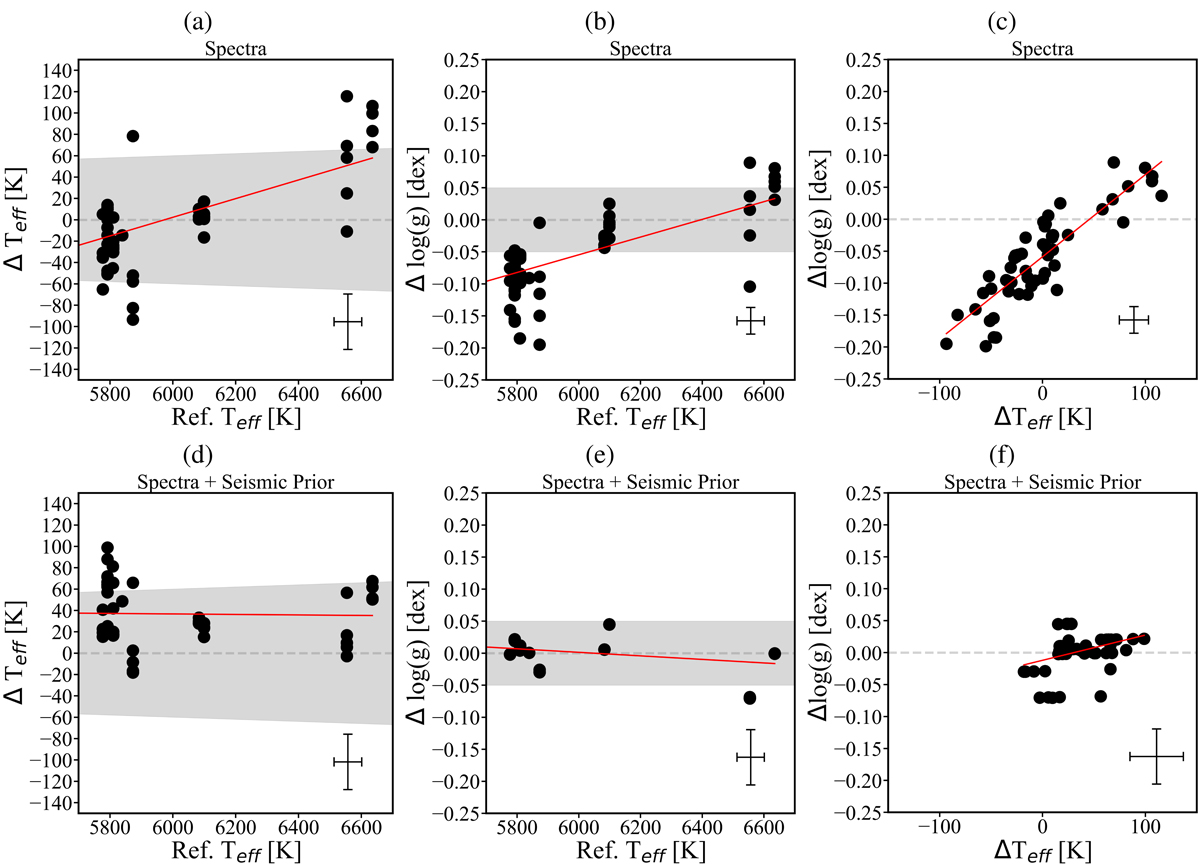
SAPP spectroscopic parameters Teff and log g of the benchmark stars that have interferometric Teff reference values above 5500 K (this includes two KIC stars 16 Cyg A and B). The vertical axis represents the residuals between Teff, log g, and their corresponding reference values. The horizontal axis represents the reference parameters. The red line is a linear regression of the data points. Top panel: results produced by the SAPP constrained spectroscopy module, and bottom panel: results produced by the SAPP constrained spectroscopy module with a νmax prior applied. The grey shaded region is our tolerance of 1% for Teff and 0.05 dex for log g. The average uncertainty in each panel is located at the bottom right. For each star, several spectra were analysed (see Sect. 2).
Current usage metrics show cumulative count of Article Views (full-text article views including HTML views, PDF and ePub downloads, according to the available data) and Abstracts Views on Vision4Press platform.
Data correspond to usage on the plateform after 2015. The current usage metrics is available 48-96 hours after online publication and is updated daily on week days.
Initial download of the metrics may take a while.