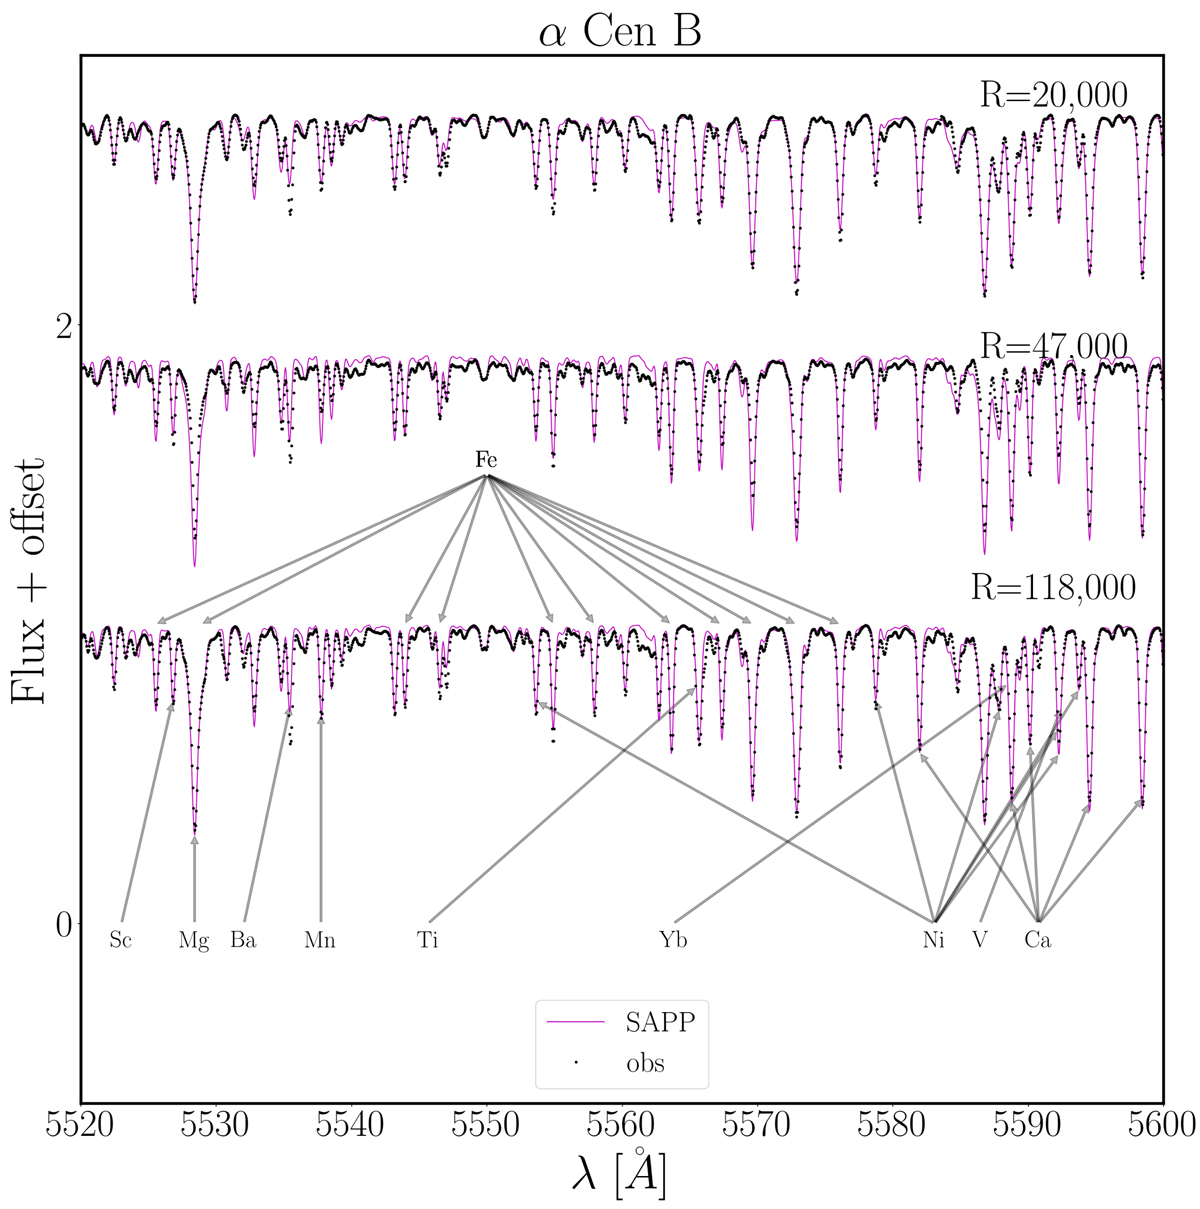
Fig. 4.
Download original image
Normalised flux versus wavelength in angstroms. The observed spectra of α Cen B (black dots) is overlaid with SAPP’s best-fit model from the spectroscopy module (magenta solid line). This contains HARPS, UVES, and HR10 spectra with original resolving powers R ∼ 118 000, 47 000, and 20 000 respectively. The UVES and HARPS spectra have been convolved down to the resolution of HR10.
Current usage metrics show cumulative count of Article Views (full-text article views including HTML views, PDF and ePub downloads, according to the available data) and Abstracts Views on Vision4Press platform.
Data correspond to usage on the plateform after 2015. The current usage metrics is available 48-96 hours after online publication and is updated daily on week days.
Initial download of the metrics may take a while.