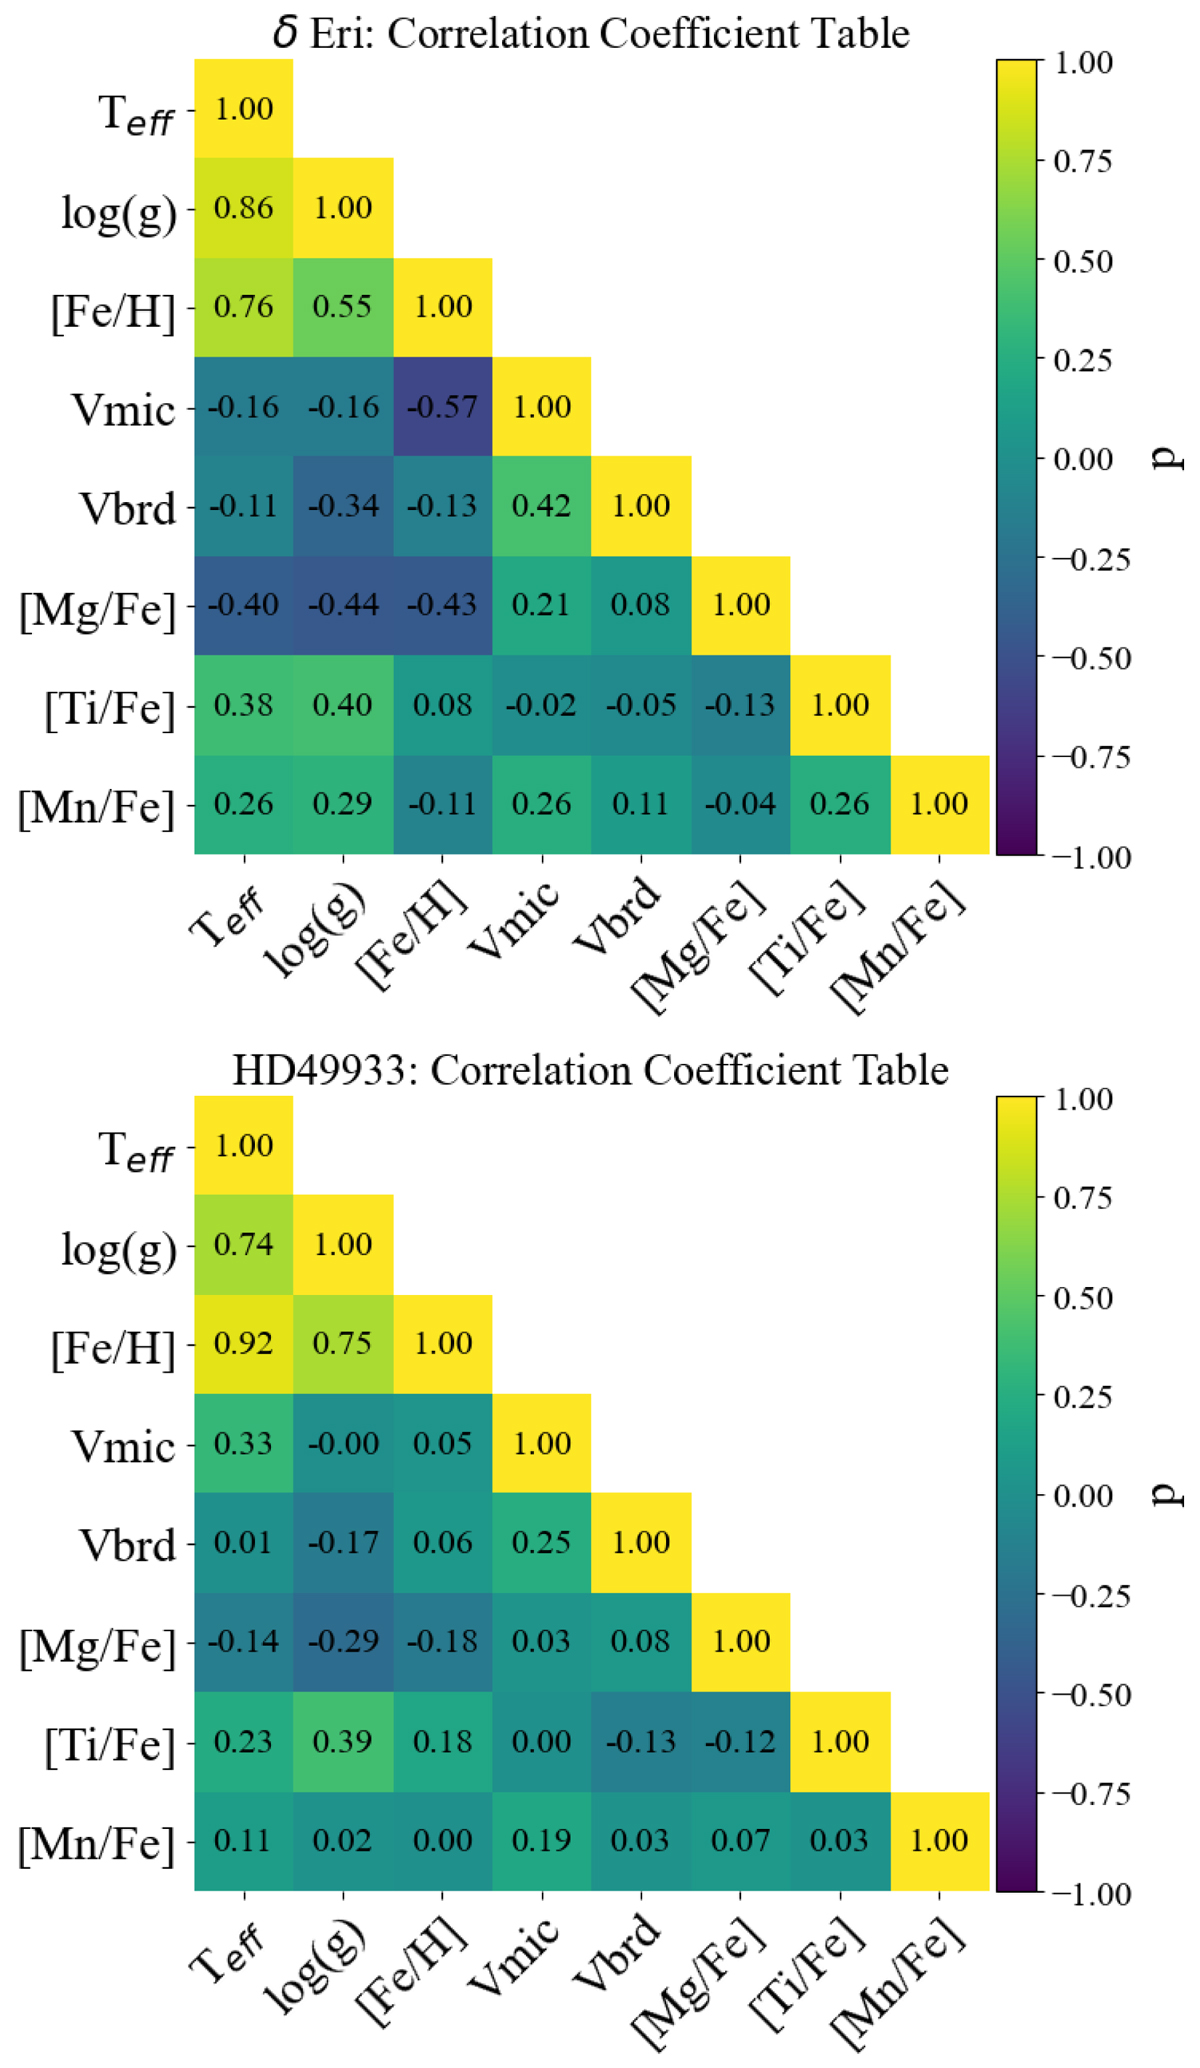
Fig. 3.
Download original image
Correlation coefficient tables. Each table has a colour scale that represents the correlation coefficient, which ranges from −1 (negatively correlated) through 0 (no correlation) to 1 (positively correlated). This number informs how each spectroscopic parameter is correlated with the others. The top table shows the coefficients for a K-type star (δ Eri) and the bottom table for a F-type star (HD 49933). The vertical and horizontal axes for both depict the eight spectroscopic parameters from the SAPP spectroscopy module.
Current usage metrics show cumulative count of Article Views (full-text article views including HTML views, PDF and ePub downloads, according to the available data) and Abstracts Views on Vision4Press platform.
Data correspond to usage on the plateform after 2015. The current usage metrics is available 48-96 hours after online publication and is updated daily on week days.
Initial download of the metrics may take a while.