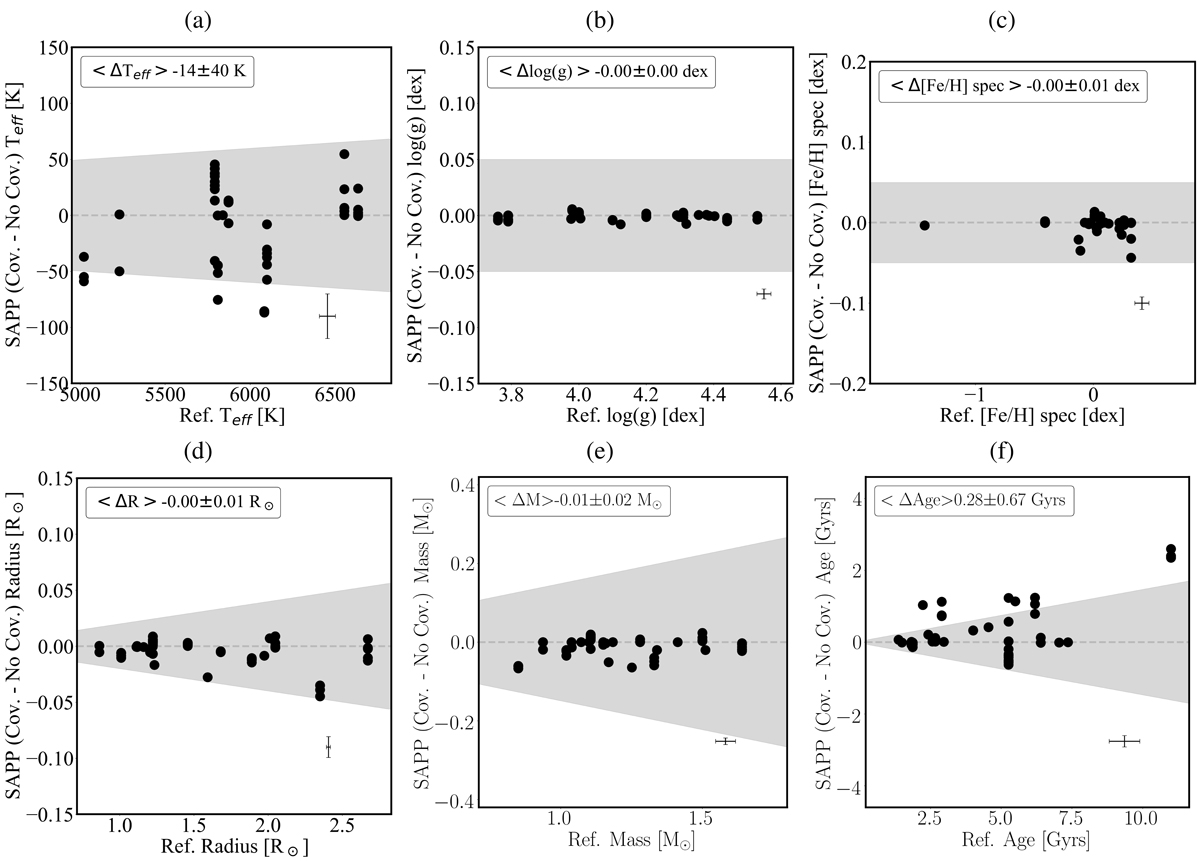
Fig. C.1.
Download original image
Differences between SAPP best-fit parameters from Bayesian scheme calculated with and without covariance matrix from spectroscopy (vertical axes) versus the reference parameters presented in Table 1 (horizontal axes). The uncertainty represents the 1 σ deviation. The grey shaded region represents the desired errors: 1% for Teff, 0.05 dex for log g and [Fe/H], 15% for mass, 10% for age, and 2% for radius.
Current usage metrics show cumulative count of Article Views (full-text article views including HTML views, PDF and ePub downloads, according to the available data) and Abstracts Views on Vision4Press platform.
Data correspond to usage on the plateform after 2015. The current usage metrics is available 48-96 hours after online publication and is updated daily on week days.
Initial download of the metrics may take a while.