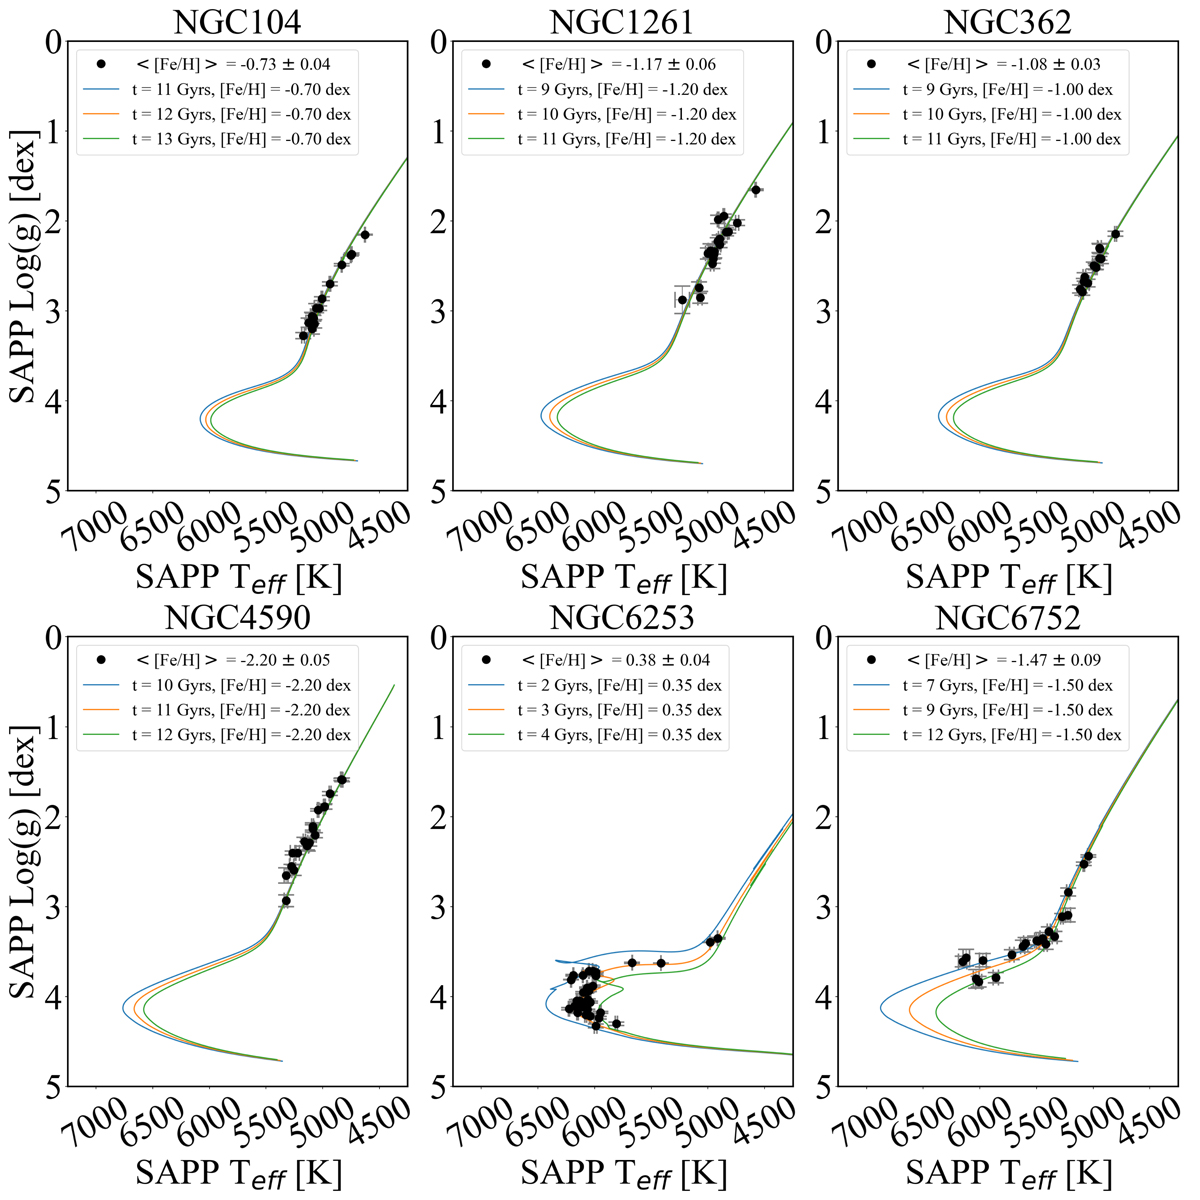
Fig. 11.
Download original image
Teff − log g diagram of the Gaia-ESO clusters. Only data analysed in this work with the SAPP are shown. In each panel, the black solid circles are a star with corresponding error bars in Teff and log g. There are three isochrones varying in age (blue youngest, orange median, green oldest) which have a metallicity close to the average [Fe/H] of the cluster.
Current usage metrics show cumulative count of Article Views (full-text article views including HTML views, PDF and ePub downloads, according to the available data) and Abstracts Views on Vision4Press platform.
Data correspond to usage on the plateform after 2015. The current usage metrics is available 48-96 hours after online publication and is updated daily on week days.
Initial download of the metrics may take a while.