Open Access
Fig. 1.
Download original image
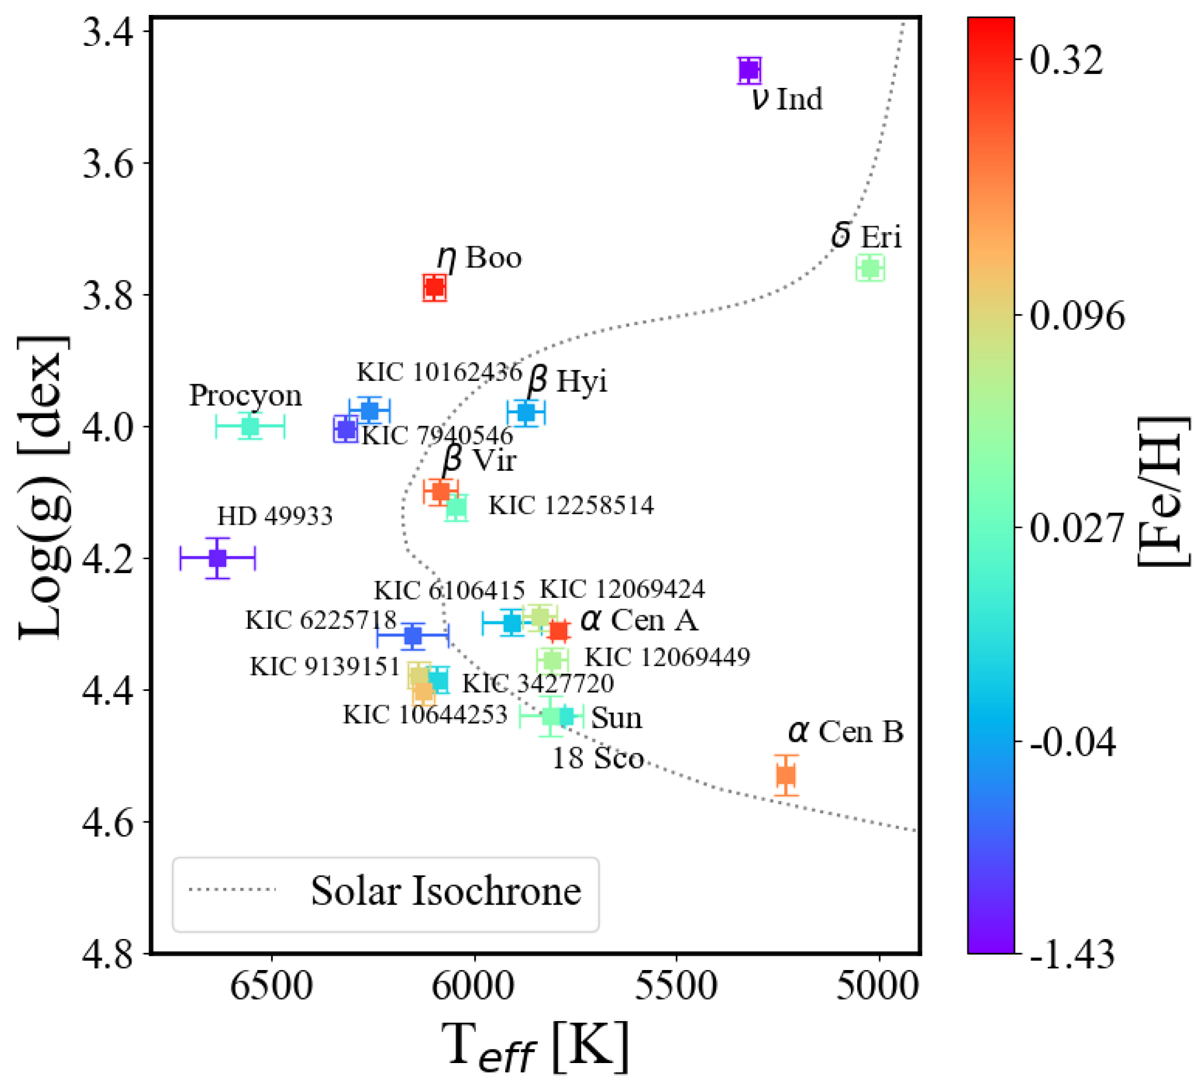
Teff − log g relation of the benchmark targets. The colour scale represents metallicity (the blue end is metal poor and the red end is just above solar metallicity). Each star is plotted with its reference values (Table 1) on top of a solar isochrone.
Current usage metrics show cumulative count of Article Views (full-text article views including HTML views, PDF and ePub downloads, according to the available data) and Abstracts Views on Vision4Press platform.
Data correspond to usage on the plateform after 2015. The current usage metrics is available 48-96 hours after online publication and is updated daily on week days.
Initial download of the metrics may take a while.