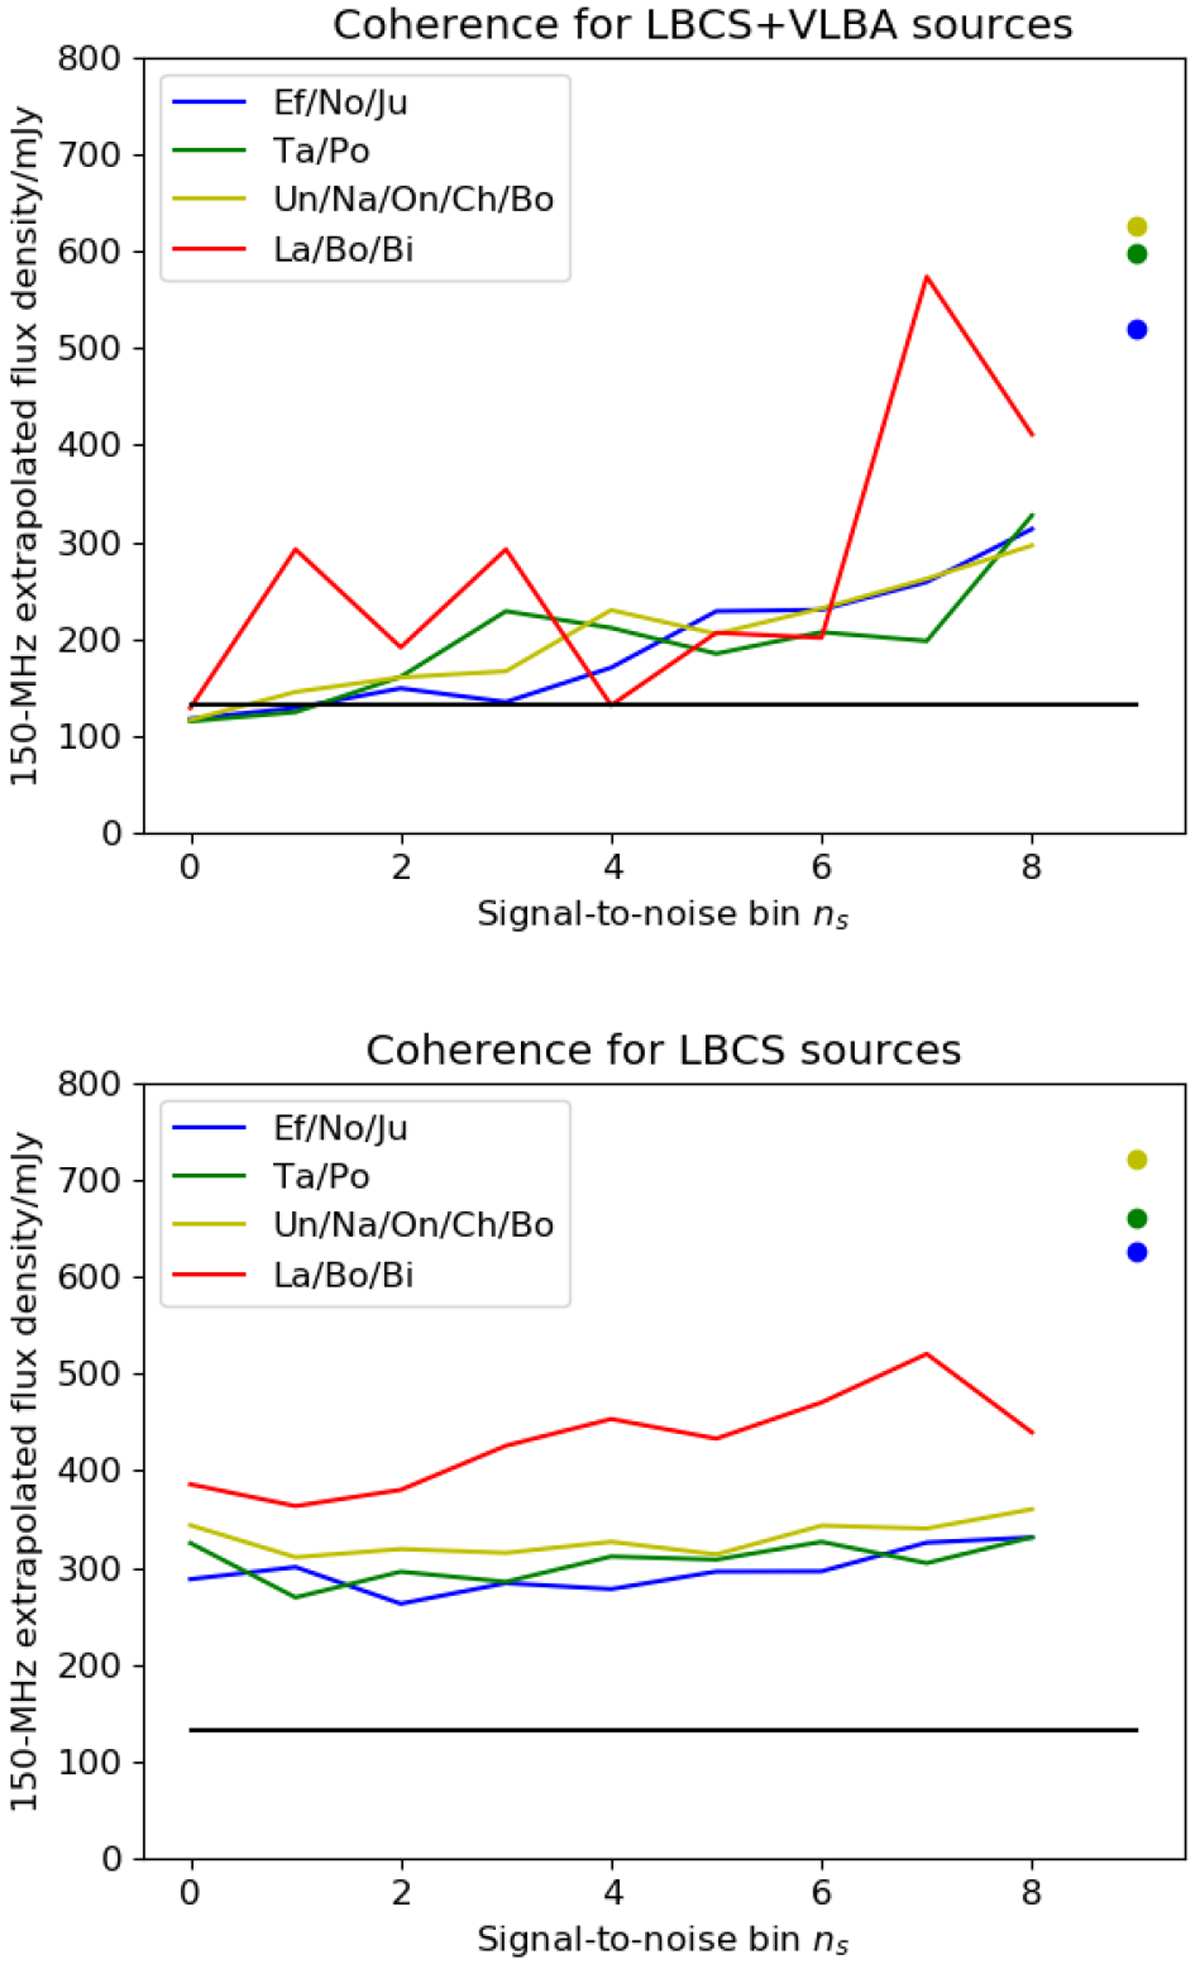
Fig. 6
Download original image
Extrapolated 150 MHz flux densities vs the LBCS signal-to-noise statistic nS. Top: signal-to-noise bin nS (with the adopted scaling of ≤132 mJy for nS =0 to ≥370 mJy for nS =9) vs flux for LBCS sources in the VLBA calibrator list. Blue lines (for nS < 9) and points (nS = 9) represent stations close to the Exloo core: DE601/Effelsberg, DE605/Jülich and DE609/Norderstedt; green for somewhat more distant stations: DE603/Tautenberg, DE604/Potsdam; yellow for more distant stations DE602/Unterweilenbach, FR606/Nançay, SE608/Onsala, UK608/Chilbolton, PL610/Borowiec. The red lines represent the furthest stations (PL611/Łazy, PL612/Baldy, IE613/Birr) and are noisy due to the small number of observations. For these stations, the points for nS = 9 (not shown)are above the top of the plot. Bottom: as above, but for all sources, not just those in the VLBA calibrator list. The black line is the level registered by observations of blank sky, for which the signal-to-noise statistic saturates.
Current usage metrics show cumulative count of Article Views (full-text article views including HTML views, PDF and ePub downloads, according to the available data) and Abstracts Views on Vision4Press platform.
Data correspond to usage on the plateform after 2015. The current usage metrics is available 48-96 hours after online publication and is updated daily on week days.
Initial download of the metrics may take a while.