Fig. 7.
Download original image
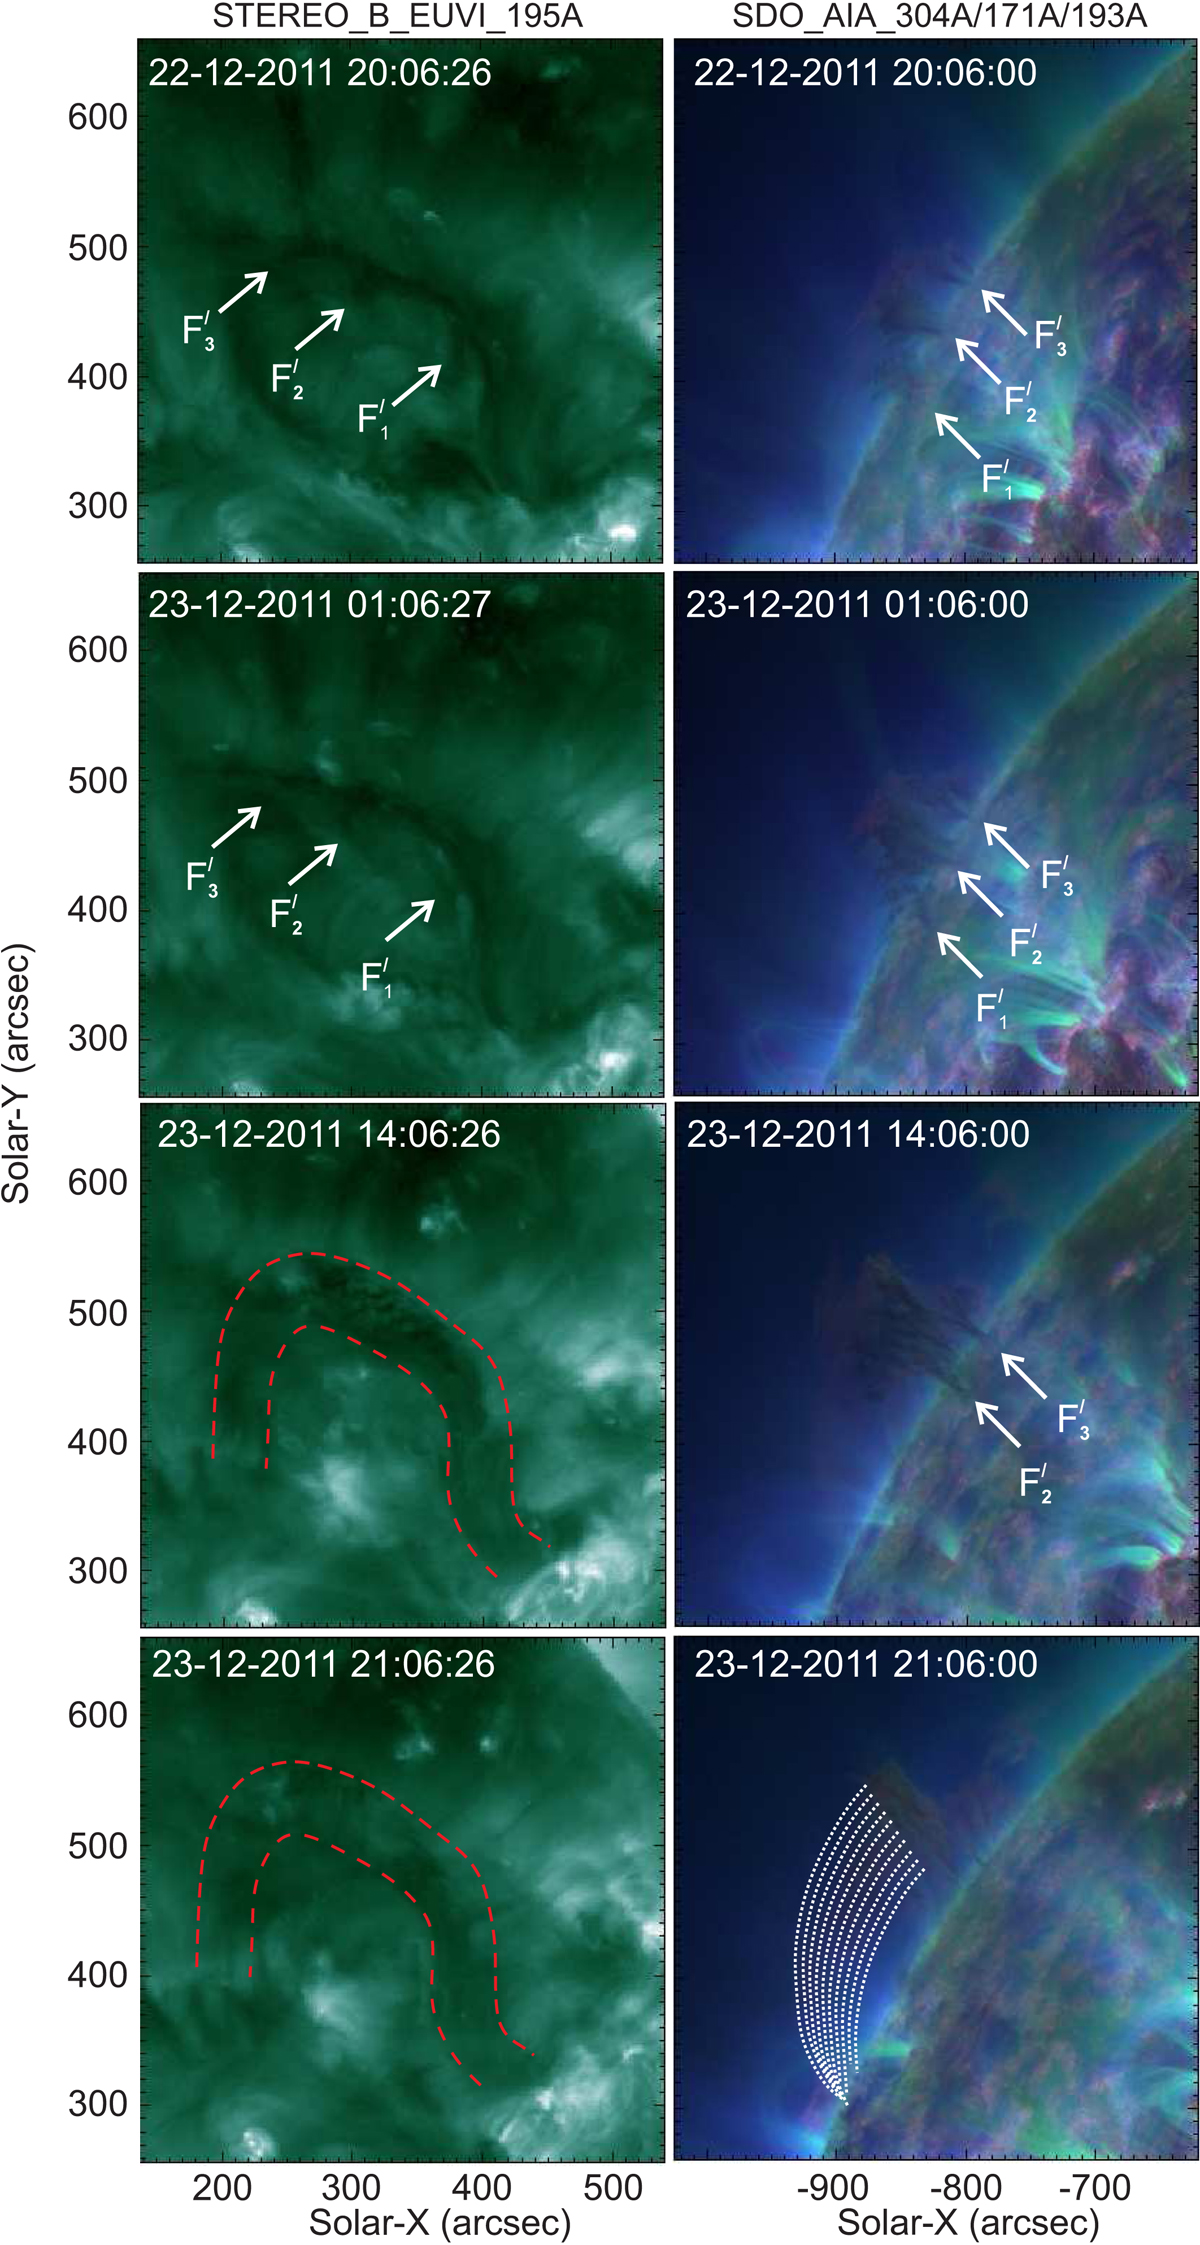
Evolution of target prominence-filament from 20:06 UT, December 22, 2011 until 21:06 UT, December 23, 2011, in SDO and Stereo_B spectral lines. Right column: composite images of 304 Å, 171 Å, and 193 Å lines from SDO_AIA, Left column: the 195 Å line of Stereo_B-EUVI. White arrows marked with ![]() ,
, ![]() , and
, and ![]() show the locations of prominence footpoints in both spacecrafts. Red dashed-curved lines show approximate boundaries of prominence, while the white dotted-curved lines in the lower right panel show the trajectories of coronal rain.
show the locations of prominence footpoints in both spacecrafts. Red dashed-curved lines show approximate boundaries of prominence, while the white dotted-curved lines in the lower right panel show the trajectories of coronal rain.
Current usage metrics show cumulative count of Article Views (full-text article views including HTML views, PDF and ePub downloads, according to the available data) and Abstracts Views on Vision4Press platform.
Data correspond to usage on the plateform after 2015. The current usage metrics is available 48-96 hours after online publication and is updated daily on week days.
Initial download of the metrics may take a while.