Free Access
Fig. 6.
Download original image
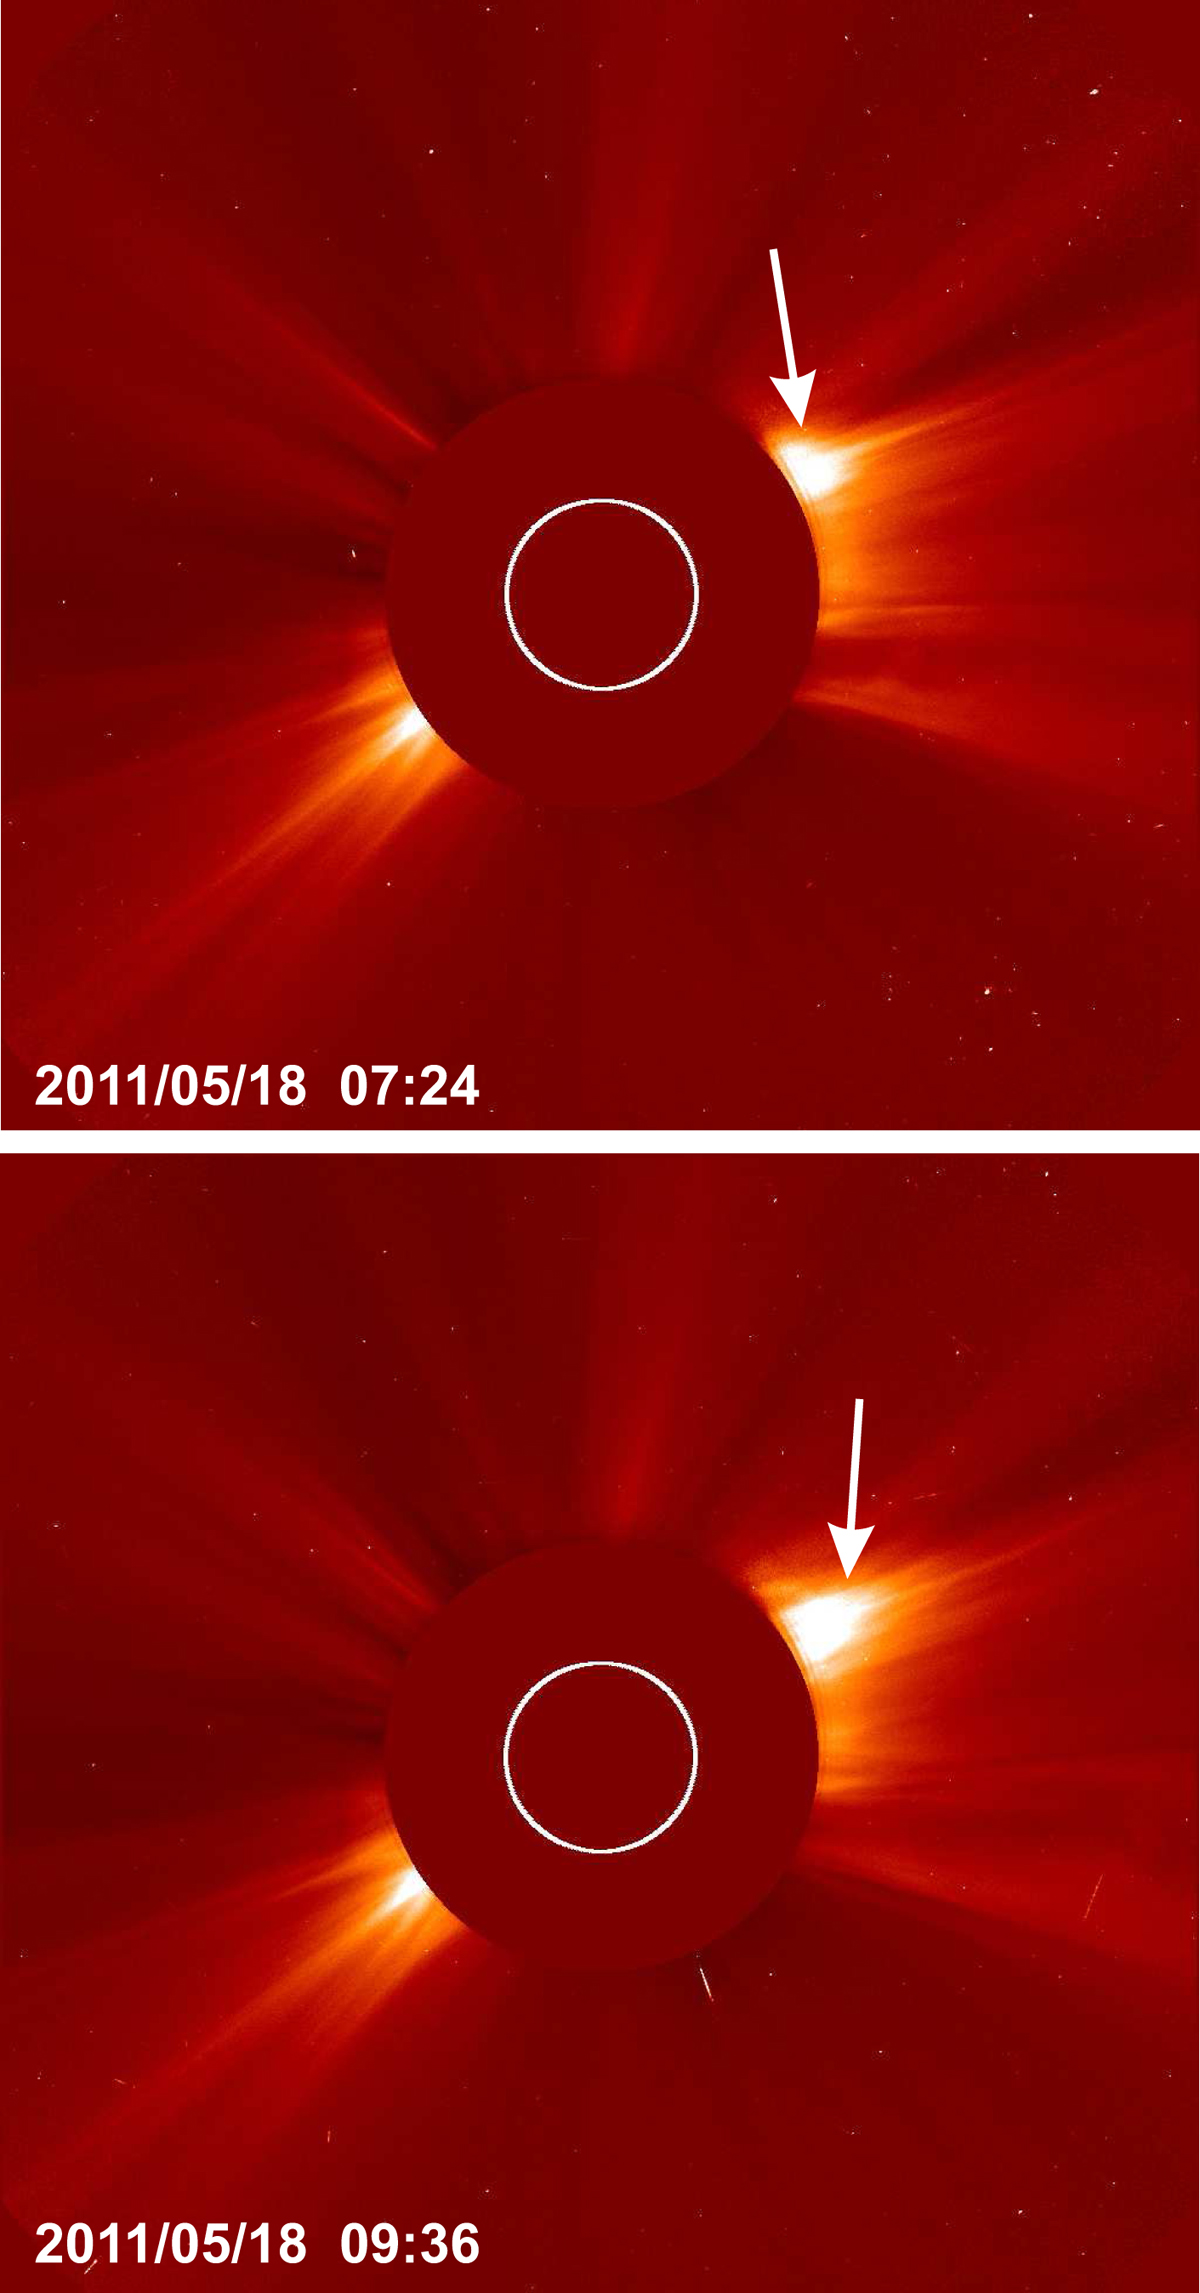
CME eruption after the prominence instability as seen from LASCO_C2_SOHO. C2 displays an image in white light at a distance of 2.1–6 solar radii. The white arrows indicate the location of the CME. The two images show the time evolution of the CME at 07:24 UT (upper panel) and at 09:36 UT (lower panel) on May 18, 2011.
Current usage metrics show cumulative count of Article Views (full-text article views including HTML views, PDF and ePub downloads, according to the available data) and Abstracts Views on Vision4Press platform.
Data correspond to usage on the plateform after 2015. The current usage metrics is available 48-96 hours after online publication and is updated daily on week days.
Initial download of the metrics may take a while.