Fig. 5.

Download original image
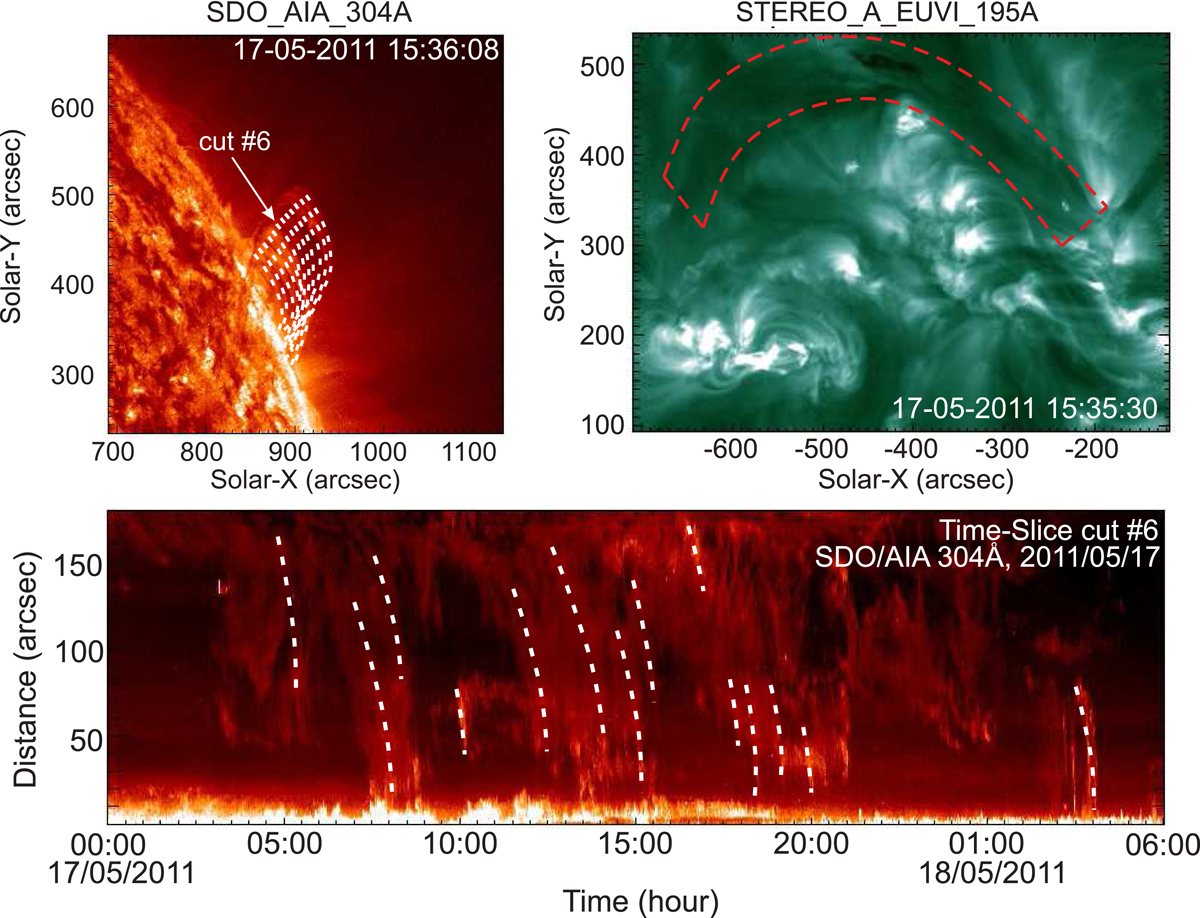
Simultaneous images taken at 15:36 UT on May 17, 2011, from SDO_AIA and Stereo_A-EUVI. Top left panel: composite image of 12 visible trajectories of falling plasma with white dotted lines, from SDO_AIA. Top right frame: area of prominence tube with a red dashed line in 195 Å wavelength from Stereo_A-EUVI spacecraft. Bottom image: space-time diagram of falling plasma obtained from a typical cut along the traced path (the white arrows indicate the starting point and the position of the cut “6” trajectory in the top left panel).
Current usage metrics show cumulative count of Article Views (full-text article views including HTML views, PDF and ePub downloads, according to the available data) and Abstracts Views on Vision4Press platform.
Data correspond to usage on the plateform after 2015. The current usage metrics is available 48-96 hours after online publication and is updated daily on week days.
Initial download of the metrics may take a while.


