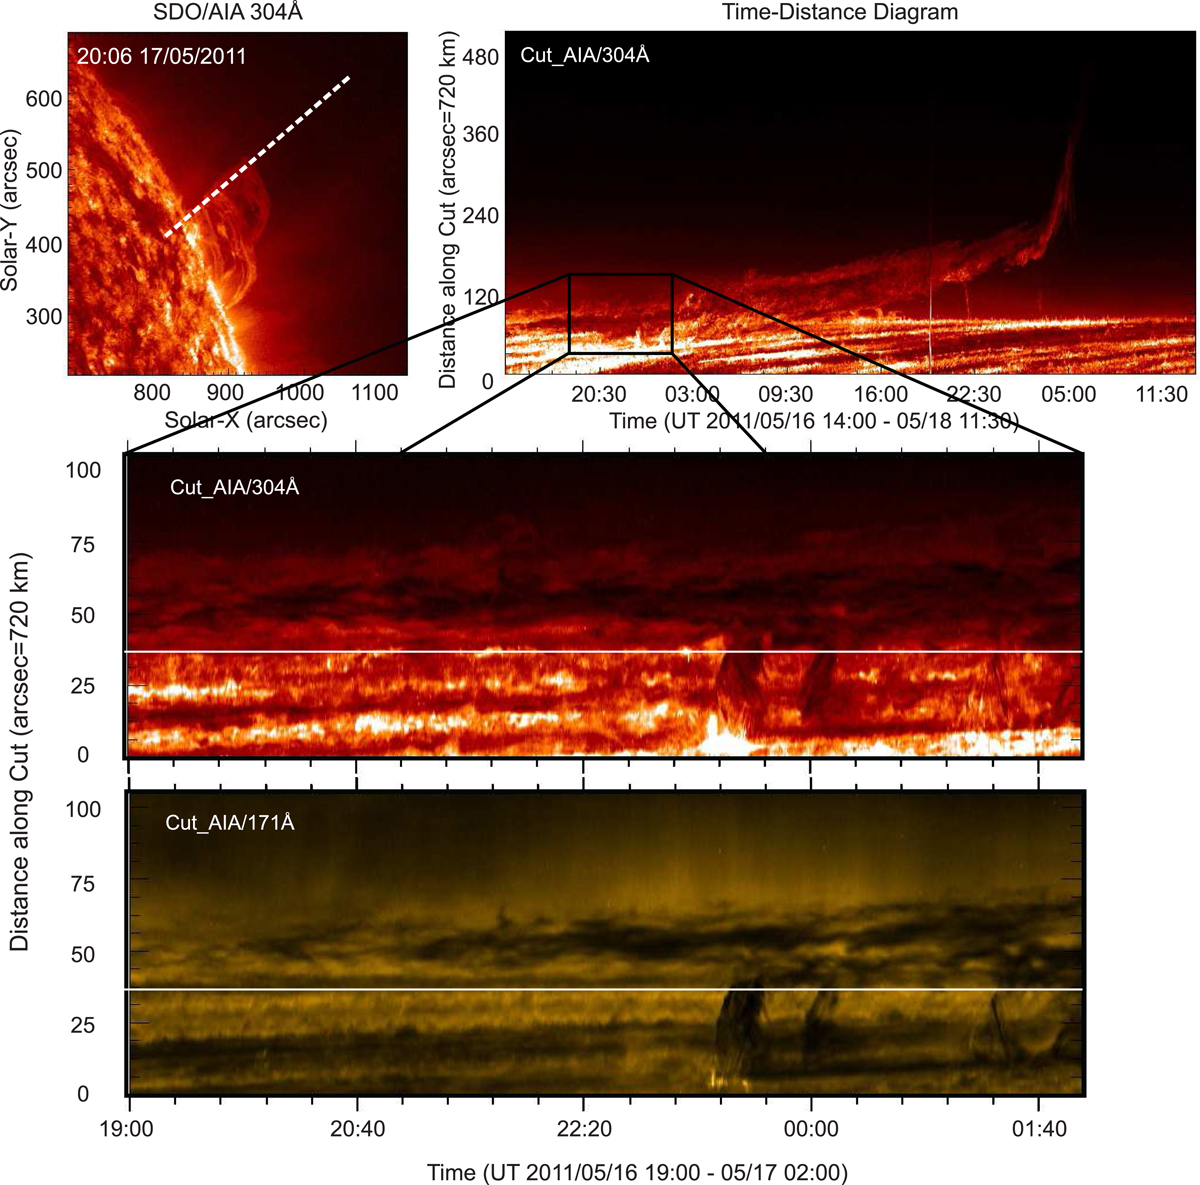
Fig. 4.
Download original image
Space-time diagram of prominence rise at a fixed cut in 304 Å line of SDO_AIA during 14:06 UT, May 16, 2011 and 11:30 UT, May 18, 2011 (top right panel). The location of the cut is shown by a white dashed line in the top left panel. Middle and the lower panels: zoomed-in image of a black box corresponding to the interval of 19:00 UT, May 16, 2011–02:00 UT, May 17, 2011 (that is before the start of slow rising) in 304 Å (middle panel) and 171 Å (lower panel) lines.
Current usage metrics show cumulative count of Article Views (full-text article views including HTML views, PDF and ePub downloads, according to the available data) and Abstracts Views on Vision4Press platform.
Data correspond to usage on the plateform after 2015. The current usage metrics is available 48-96 hours after online publication and is updated daily on week days.
Initial download of the metrics may take a while.