Free Access
Fig. 15.
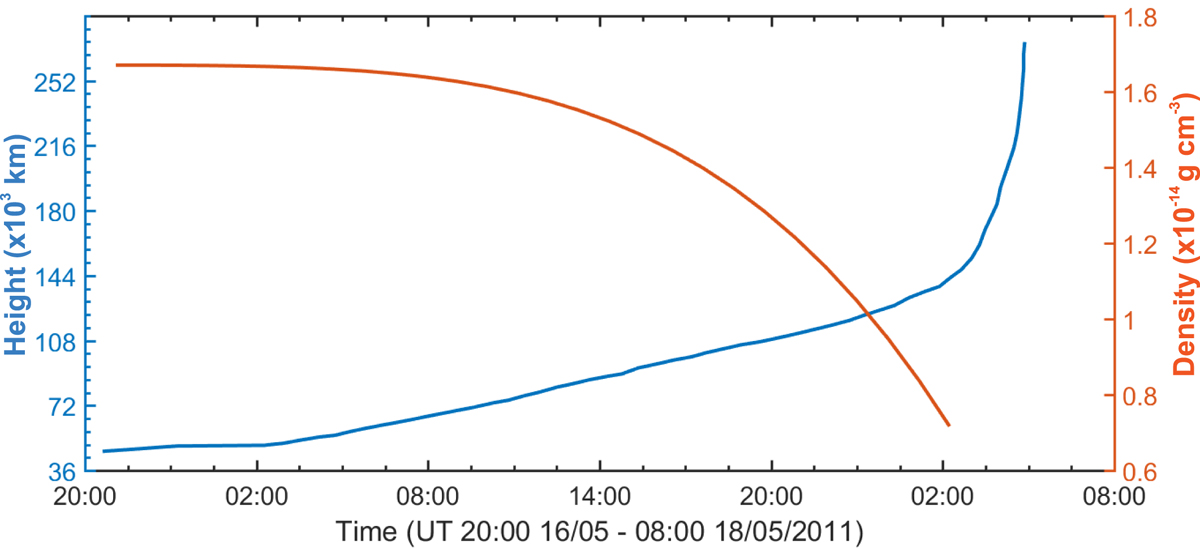
Download original image
Upward rise of the prominence along the cut on Fig. 4 (blue line) and estimated decrease of density due to coronal rain (red line) during the whole evolution of prominence in the event of May 16–18, 2011.
Current usage metrics show cumulative count of Article Views (full-text article views including HTML views, PDF and ePub downloads, according to the available data) and Abstracts Views on Vision4Press platform.
Data correspond to usage on the plateform after 2015. The current usage metrics is available 48-96 hours after online publication and is updated daily on week days.
Initial download of the metrics may take a while.