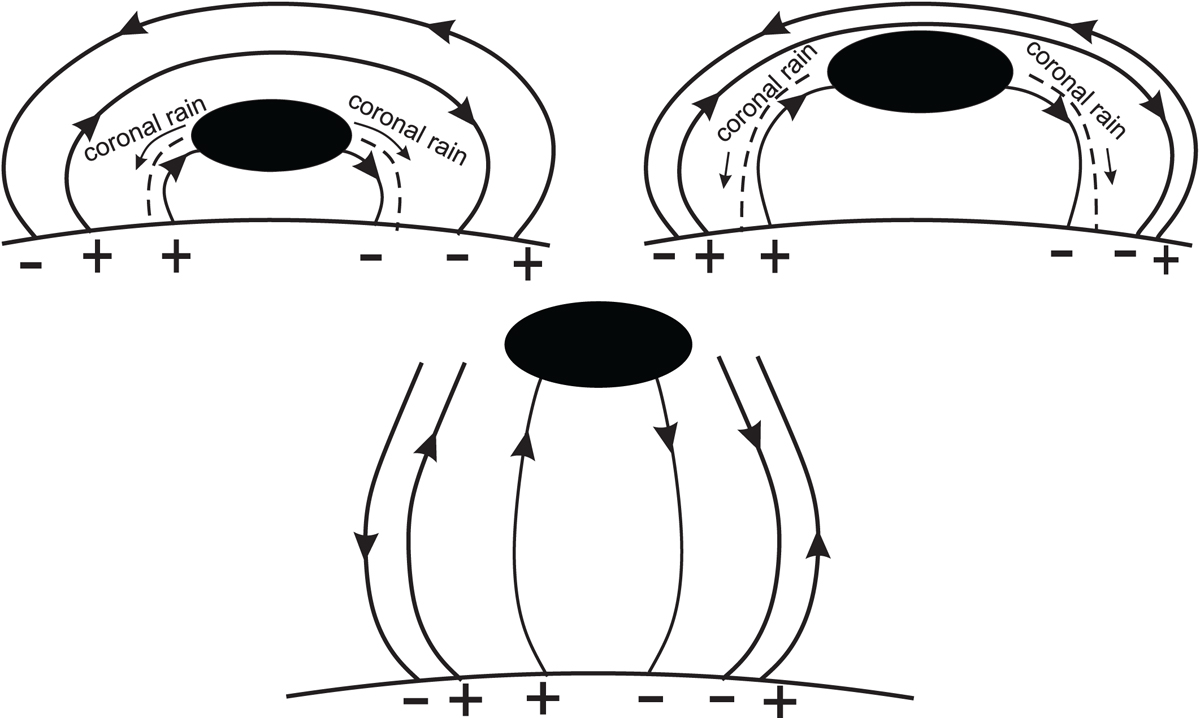
Fig. 14.
Download original image
Schematic dynamics of prominence evolution according to our model. Black ellipse represents the prominence and dashed-curved lines show the coronal rain blob trajectories. Initial configuration is shown by the upper left panel. Upper right panel displays the slow rise phase of the prominence triggered by the coronal rain. Final instability during fast rise phase and consecutive eruption of prominence as CME is shown on the lower panel.
Current usage metrics show cumulative count of Article Views (full-text article views including HTML views, PDF and ePub downloads, according to the available data) and Abstracts Views on Vision4Press platform.
Data correspond to usage on the plateform after 2015. The current usage metrics is available 48-96 hours after online publication and is updated daily on week days.
Initial download of the metrics may take a while.