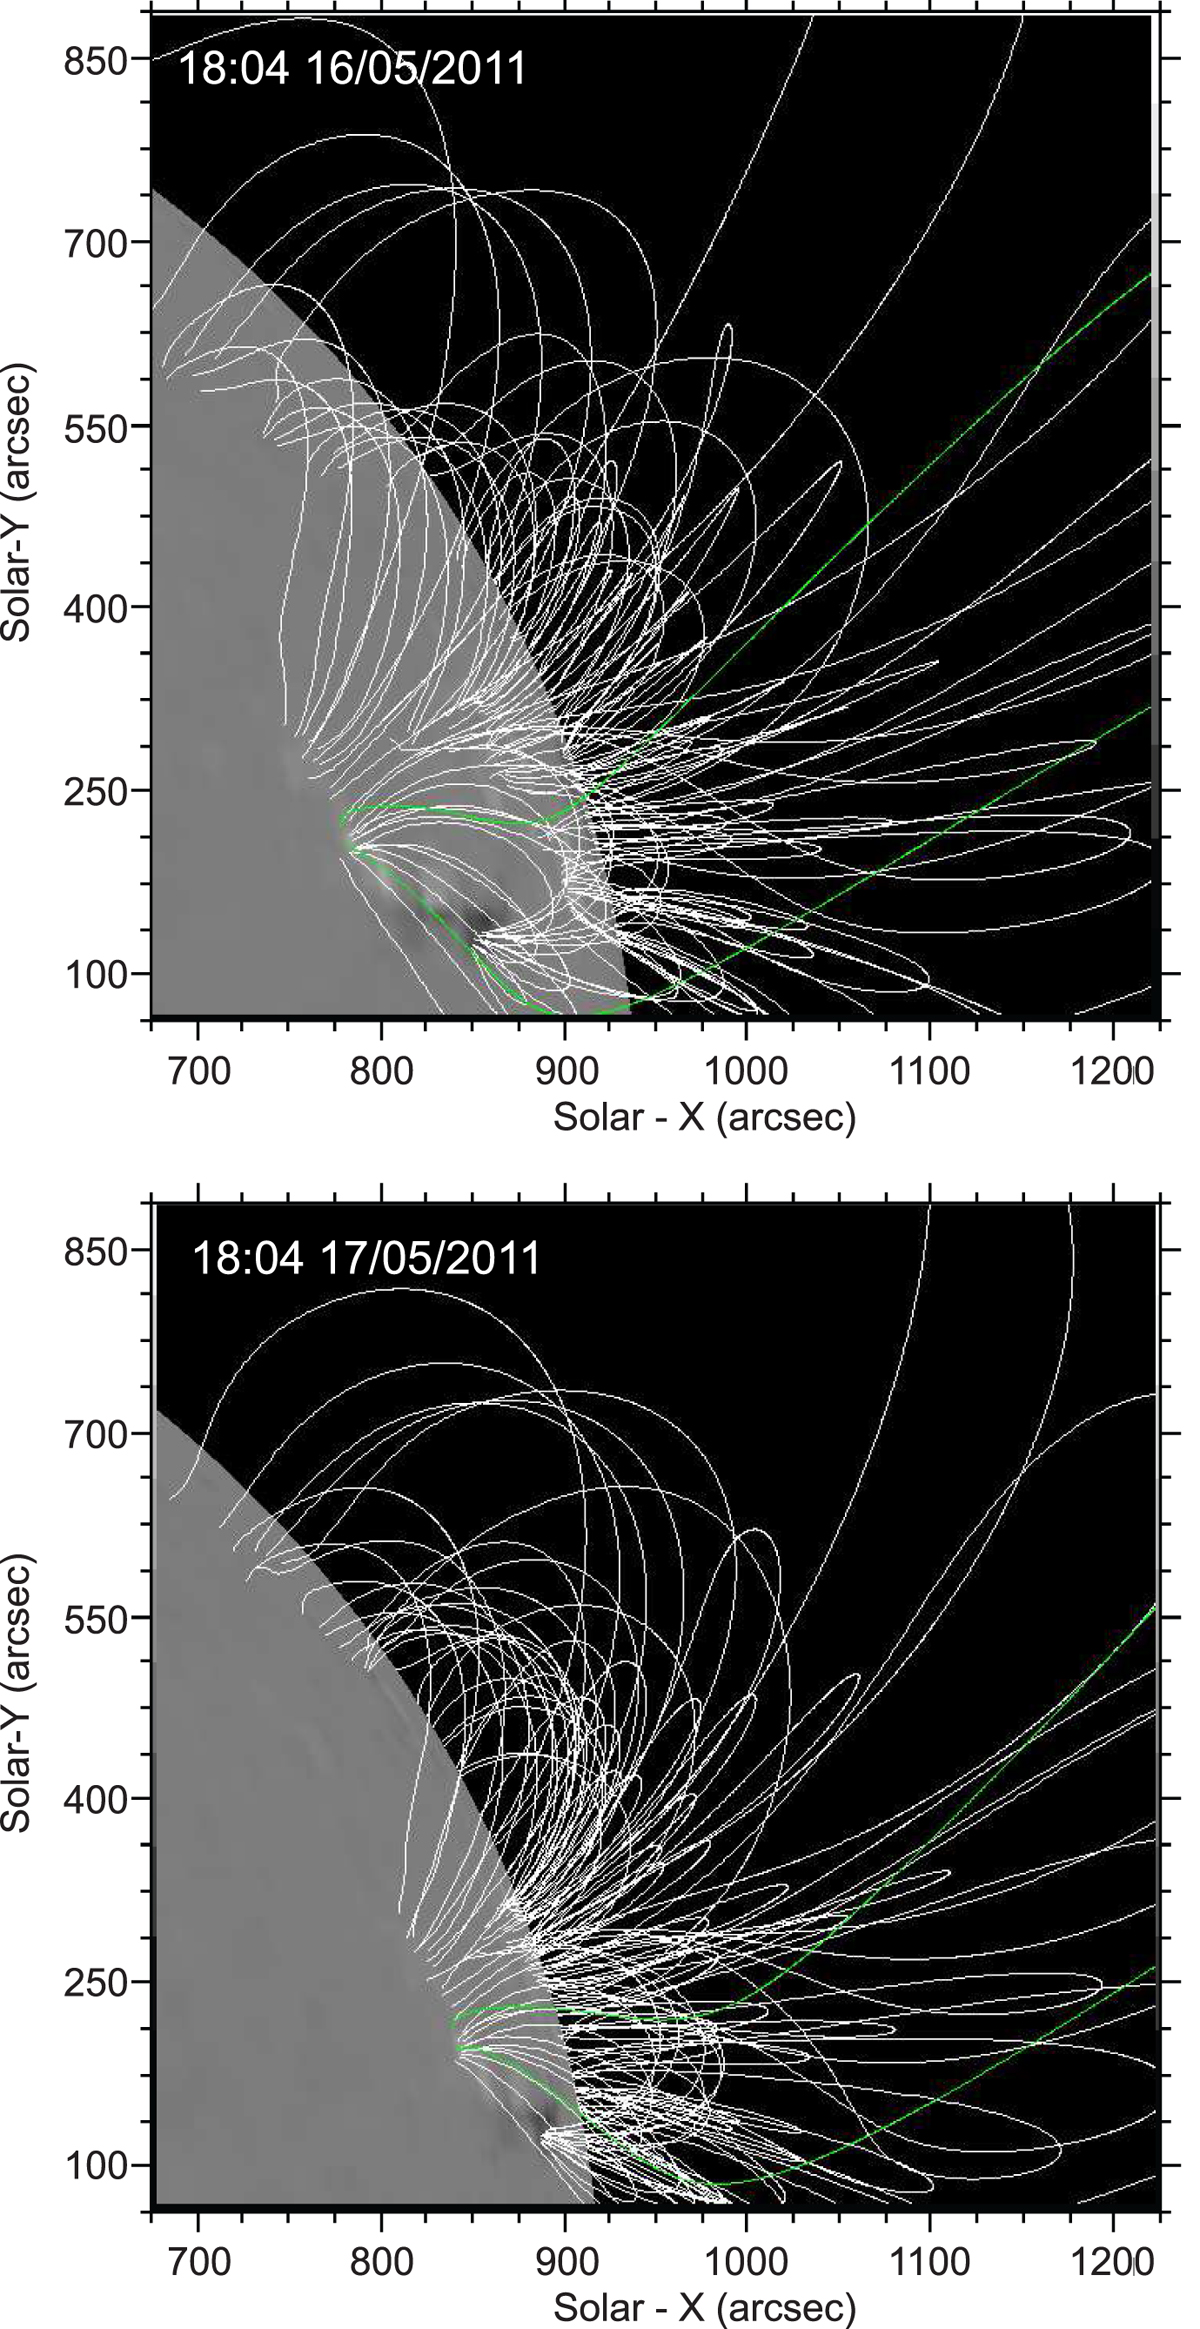
Fig. 13.
Download original image
Magnetic field extrapolation (potential-field source-surface PFSS) in prominence area before (at 18:04 UT, May 16, 2011 upper panel) and during (at 18:04 UT, May 17, 2011 lower panel) the slow rise process. White curves correspond to the close magnetic field lines, green (purple) lines show the open magnetic field lines with positive (negative) polarity.
Current usage metrics show cumulative count of Article Views (full-text article views including HTML views, PDF and ePub downloads, according to the available data) and Abstracts Views on Vision4Press platform.
Data correspond to usage on the plateform after 2015. The current usage metrics is available 48-96 hours after online publication and is updated daily on week days.
Initial download of the metrics may take a while.