Fig. 10.
Download original image
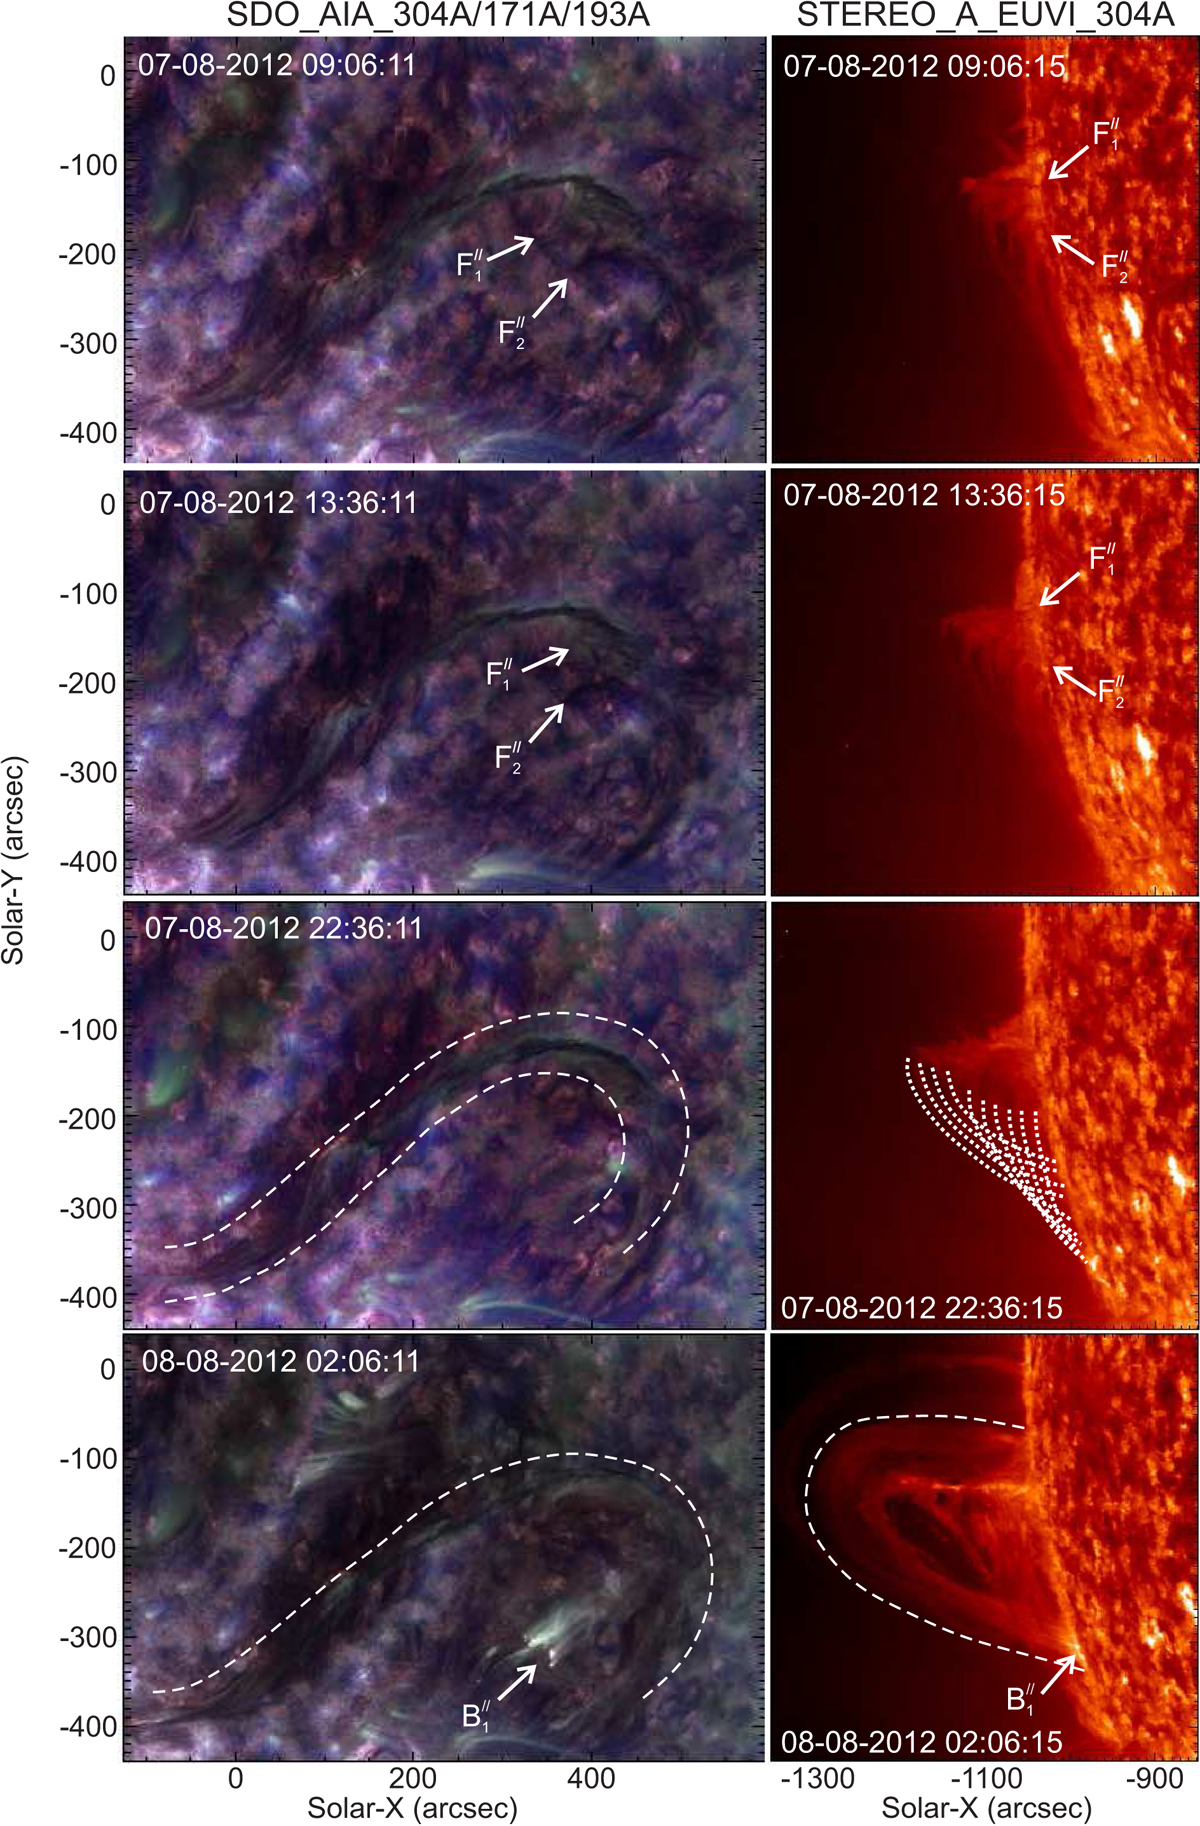
Evolution of the Prominence from 09:06 UT, August 07, 2012 to 02:06 UT, August 08, 2012 in SDO_AIA and Stereo_A-EUVI. Left panels: composite images of 304 Å, 171 Å, and 193 Å wavelength from SDO/AIA. Right panels: 304 Å wavelength of Stereo_A-EUVI. The white arrows in the top four frames, marked with ![]() and
and ![]() show the locations of prominence footpoints in both spacecrafts. White dashed-curved lines indicate approximate boundaries of prominence, while the white doted curved lines on right lower middle panel show the trajectory of coronal rain. The brightening is marked with
show the locations of prominence footpoints in both spacecrafts. White dashed-curved lines indicate approximate boundaries of prominence, while the white doted curved lines on right lower middle panel show the trajectory of coronal rain. The brightening is marked with ![]() point for identifying areas of interest.
point for identifying areas of interest.
Current usage metrics show cumulative count of Article Views (full-text article views including HTML views, PDF and ePub downloads, according to the available data) and Abstracts Views on Vision4Press platform.
Data correspond to usage on the plateform after 2015. The current usage metrics is available 48-96 hours after online publication and is updated daily on week days.
Initial download of the metrics may take a while.