Fig. 9
Download original image
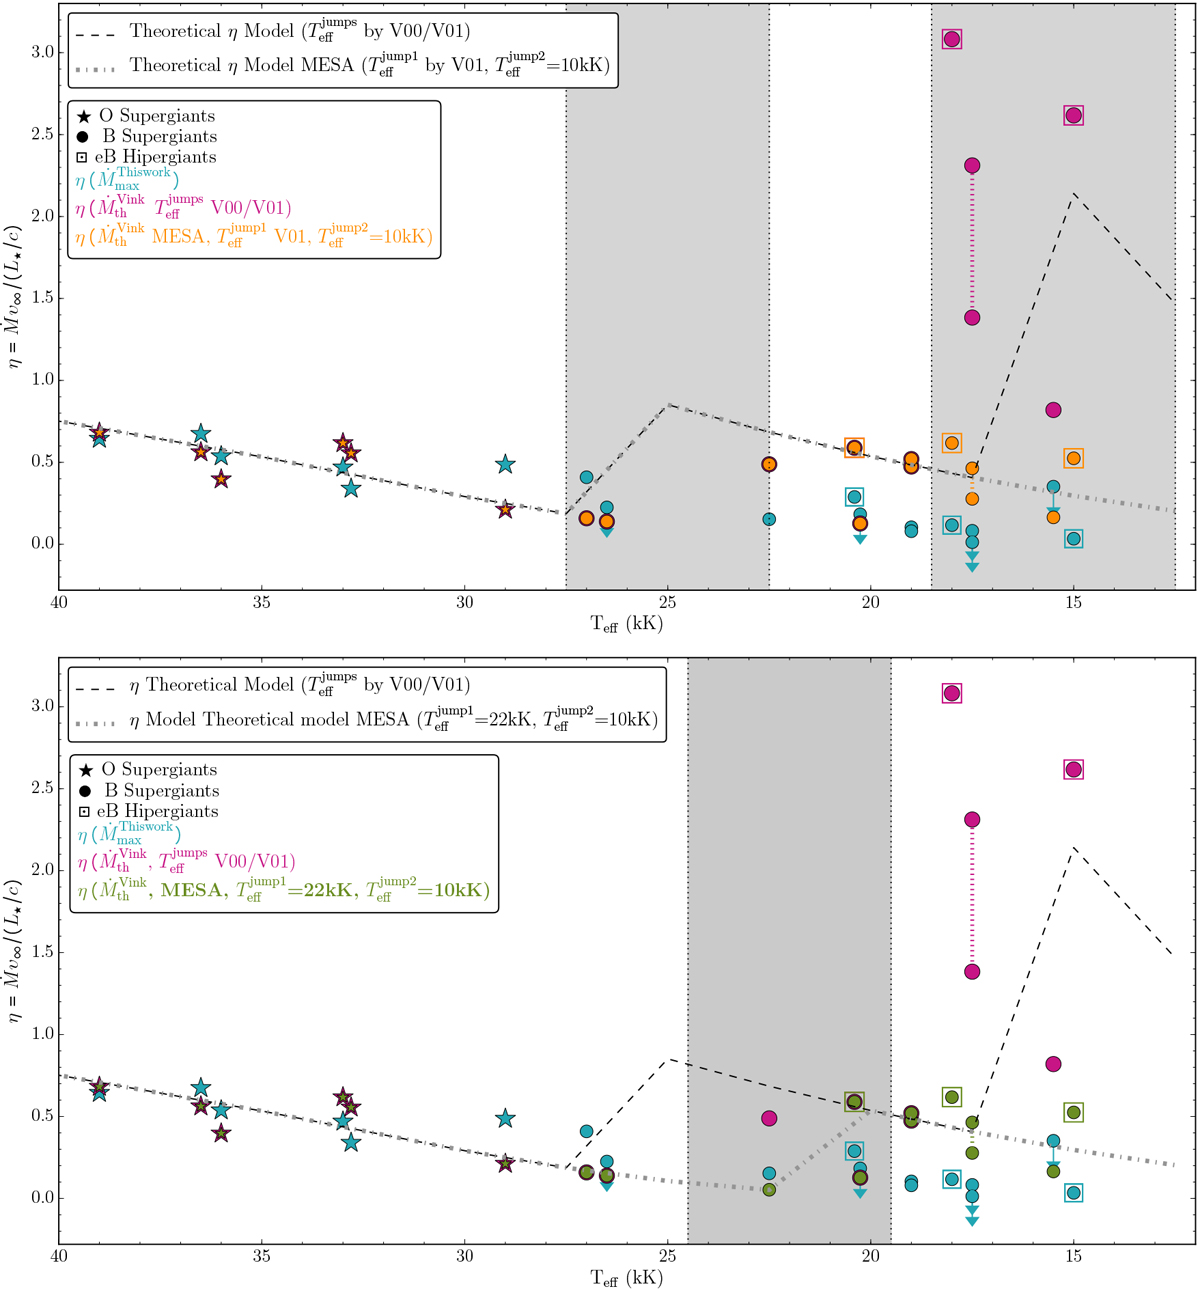
Top: empirical-maximum (Ṁmax) and theoretical (![]() ) wind performance numbers, η = Ṁ υ∞/(L*∕c), as a functionof Teff, for our OB supergiants sub-sample, in the Geneva (magenta) and MESA (orange) approaches. Dashed and dotted-dashed lines correspond to theoretical predictions for a source with log L/L⊙ = 5.75 and M* = 45 M⊙ for solar metallicity respectively based on Geneva and MESA implementations of V00 and V01. The shadowed regions represent the first (27.5–22.5 kK) and second (18.5–12.5 kK) bi-stability jump zones as defined by V00. Bottom: same as top panel, but showing theoretical wind performance numbers in the Geneva (magenta) and Fixed-jumps (light green) approaches, and a dotted-dashed line marking the theoretical model based on the Fixed-jumps implementation of V00 and V01. The shadowed region represents the first bi-stability jump zone (24.5–19.5 kK) for a central temperature of the jump of 22 kK. In both panels the early B-type Hypergiants in our sample are indicated with squares, whereas arrows indicate upper limits of Ṁmax. Finally, arrows, dotted lines, and symbols as in Fig. 8.
) wind performance numbers, η = Ṁ υ∞/(L*∕c), as a functionof Teff, for our OB supergiants sub-sample, in the Geneva (magenta) and MESA (orange) approaches. Dashed and dotted-dashed lines correspond to theoretical predictions for a source with log L/L⊙ = 5.75 and M* = 45 M⊙ for solar metallicity respectively based on Geneva and MESA implementations of V00 and V01. The shadowed regions represent the first (27.5–22.5 kK) and second (18.5–12.5 kK) bi-stability jump zones as defined by V00. Bottom: same as top panel, but showing theoretical wind performance numbers in the Geneva (magenta) and Fixed-jumps (light green) approaches, and a dotted-dashed line marking the theoretical model based on the Fixed-jumps implementation of V00 and V01. The shadowed region represents the first bi-stability jump zone (24.5–19.5 kK) for a central temperature of the jump of 22 kK. In both panels the early B-type Hypergiants in our sample are indicated with squares, whereas arrows indicate upper limits of Ṁmax. Finally, arrows, dotted lines, and symbols as in Fig. 8.
Current usage metrics show cumulative count of Article Views (full-text article views including HTML views, PDF and ePub downloads, according to the available data) and Abstracts Views on Vision4Press platform.
Data correspond to usage on the plateform after 2015. The current usage metrics is available 48-96 hours after online publication and is updated daily on week days.
Initial download of the metrics may take a while.