Fig. 8
Download original image
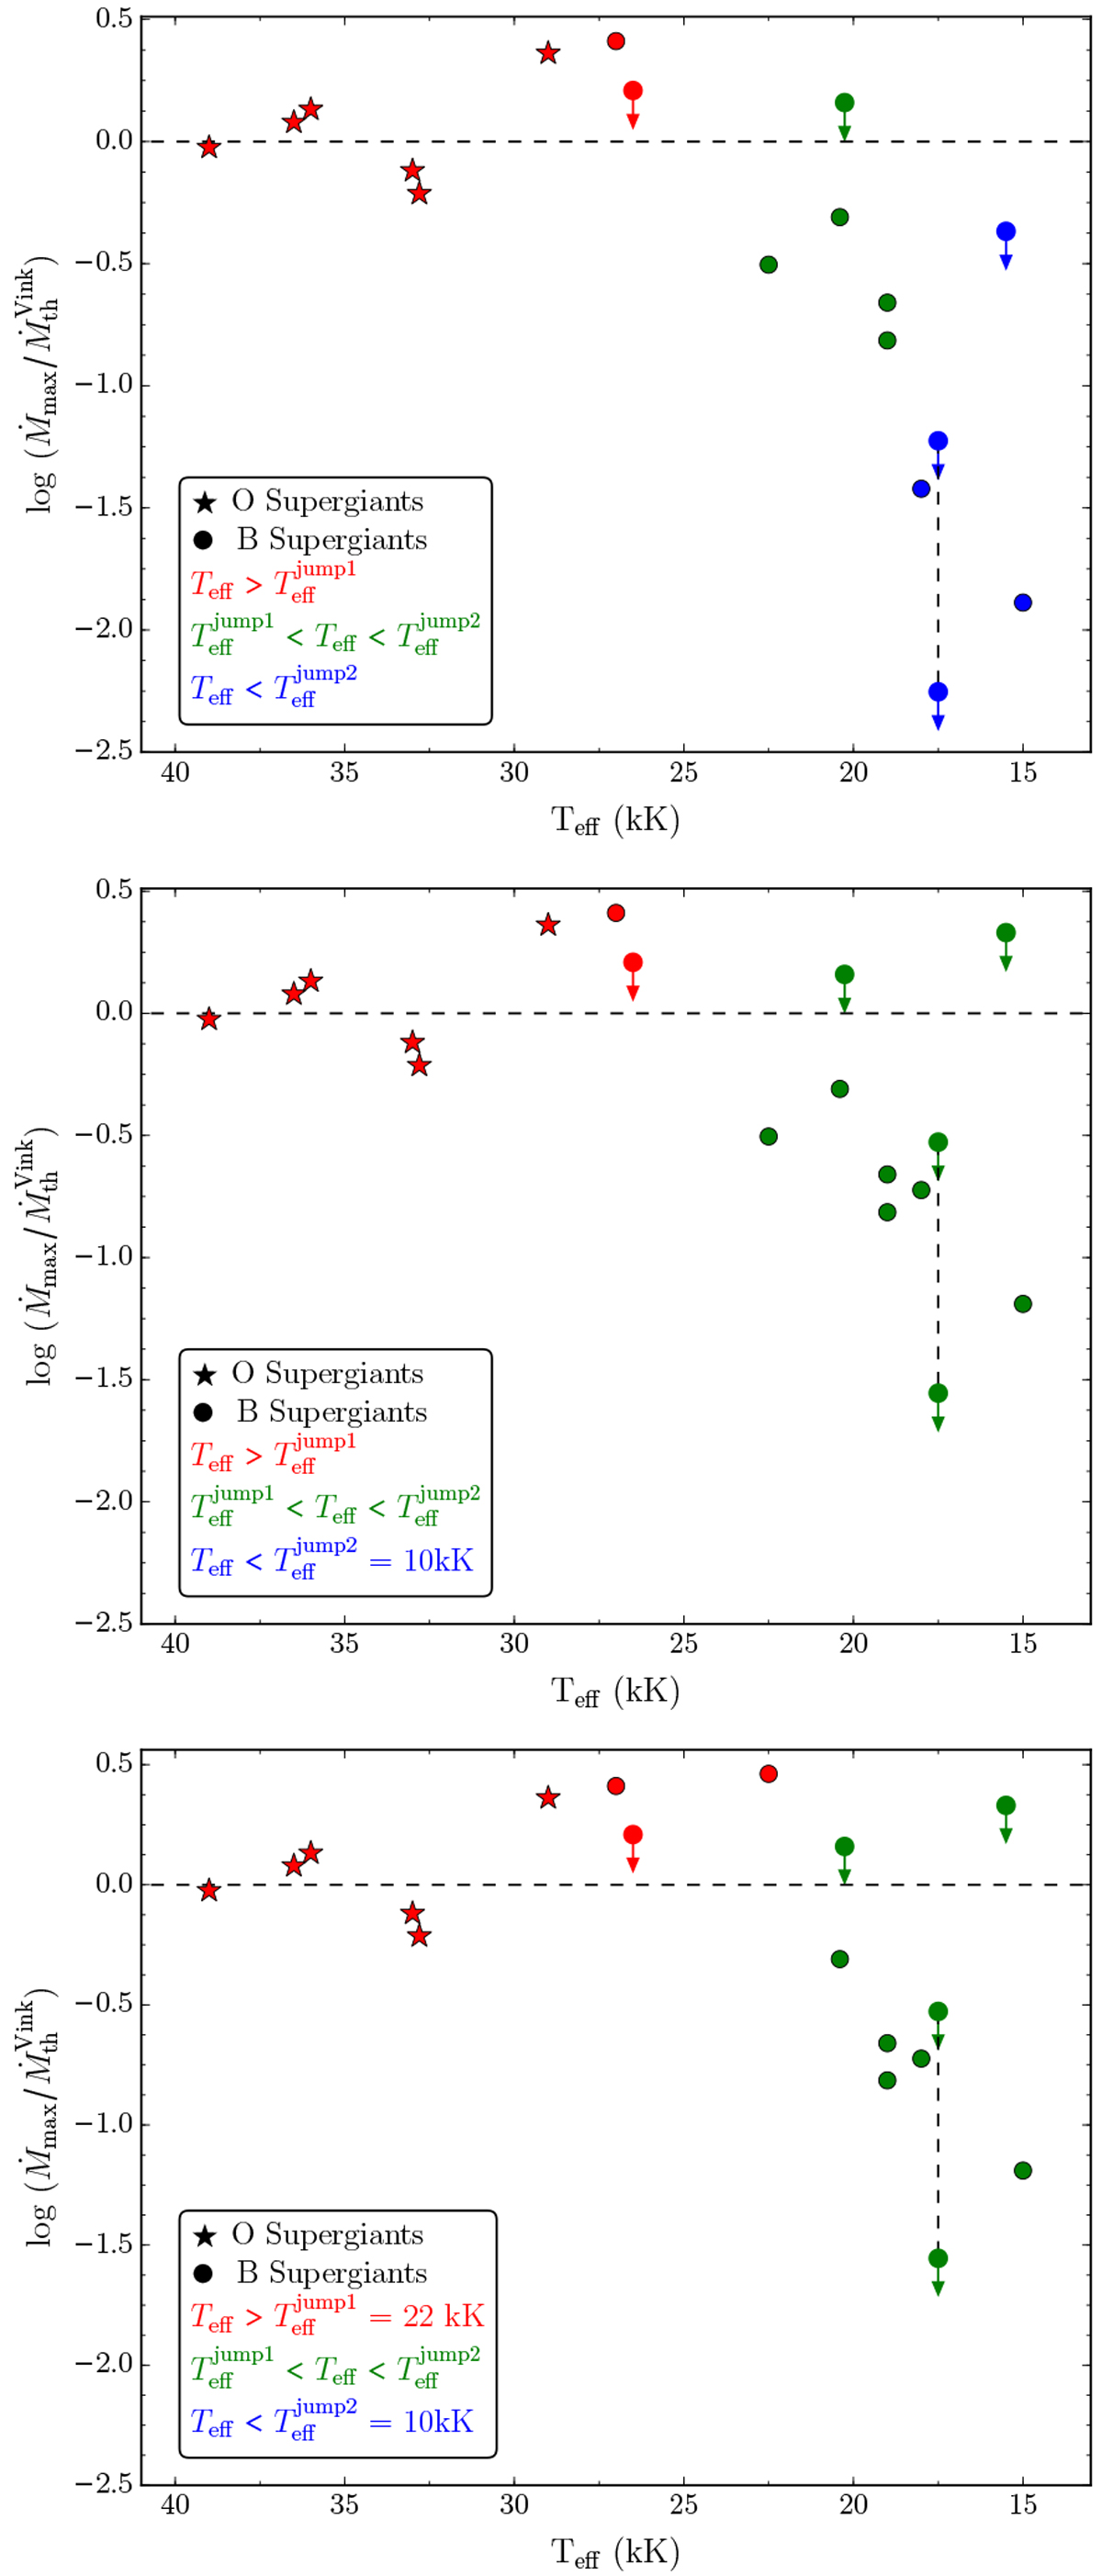
Fromtop to bottom, empirical to theoretical mass-loss rates ratio, in logarithmic scale, as a function of effective temperature for the OB supergiants sub-sample. Empirical mass-loss rates correspond to the Ṁmax derived in this work. Theoretical mass-loss rates, ![]() , correspond to the mass-loss rates computed via recipes from V00 & V01 for different definitions of the temperatures of the jumps (see Sect. 5.2); top: Geneva approach, middle: MESA approach, and bottom: fixed-jumps approach (see Sect. 5.2). Different colours indicate at which side of the bi-stability jumps the sources are located. Arrows and symbols as in Fig. 4.
, correspond to the mass-loss rates computed via recipes from V00 & V01 for different definitions of the temperatures of the jumps (see Sect. 5.2); top: Geneva approach, middle: MESA approach, and bottom: fixed-jumps approach (see Sect. 5.2). Different colours indicate at which side of the bi-stability jumps the sources are located. Arrows and symbols as in Fig. 4.
Current usage metrics show cumulative count of Article Views (full-text article views including HTML views, PDF and ePub downloads, according to the available data) and Abstracts Views on Vision4Press platform.
Data correspond to usage on the plateform after 2015. The current usage metrics is available 48-96 hours after online publication and is updated daily on week days.
Initial download of the metrics may take a while.