Fig. 6
Download original image
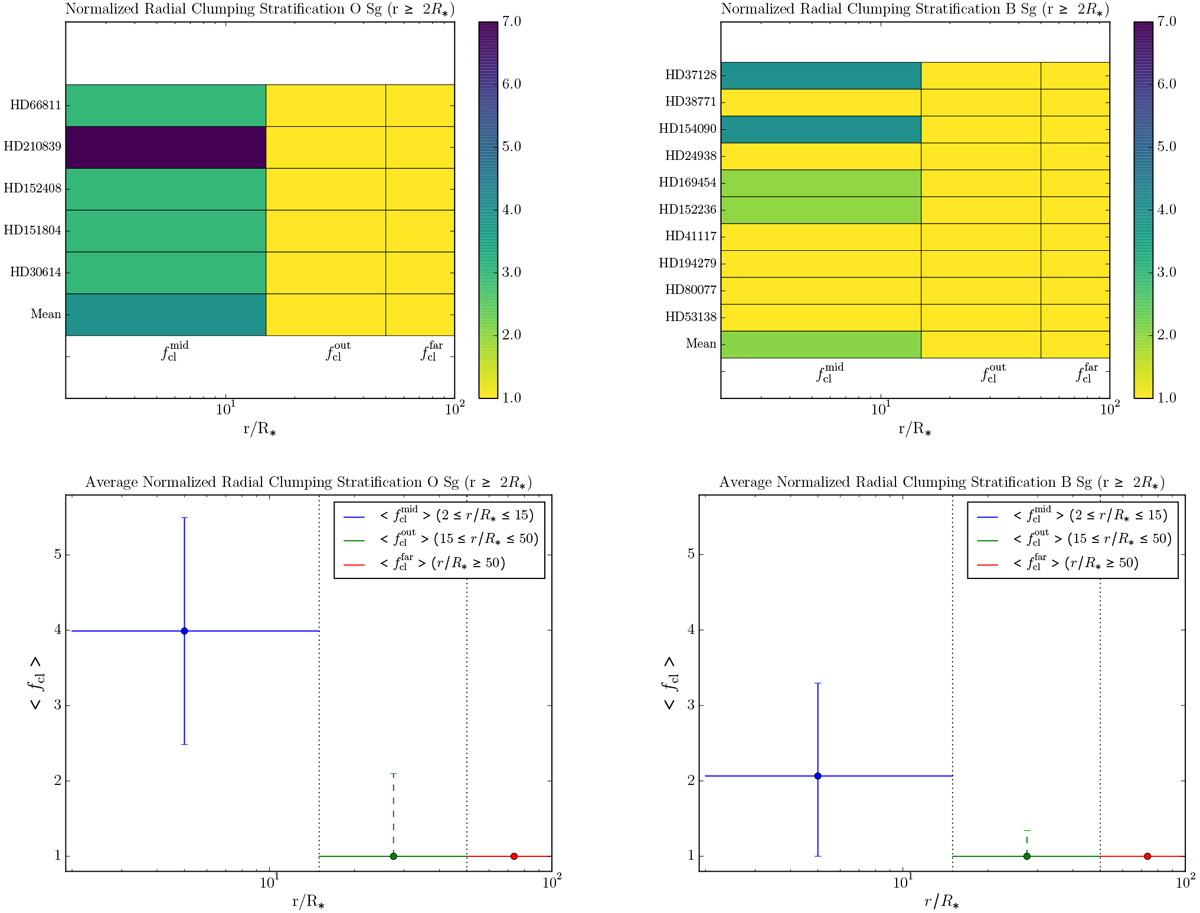
Top: individual minimum and average values of the clumping factors for r ≥ 2 R* derived in the fixed-regions approach for the sub-sample of O (left) and B (right) supergiants (see Sect. 4.2). Bottom: average minimum clumping stratification of the sub-sample as in the top panel, with error bars. Solid error bars correspond to the standard deviation of ⟨
![]() ⟩, whereas dashed error bars correspond to
⟩, whereas dashed error bars correspond to ![]() , and represent the mean of the best constrained
, and represent the mean of the best constrained ![]() listed in Table 6 (bold names). Vertical dotted lines represent the boundaries of the defined wind regions.
listed in Table 6 (bold names). Vertical dotted lines represent the boundaries of the defined wind regions.
Current usage metrics show cumulative count of Article Views (full-text article views including HTML views, PDF and ePub downloads, according to the available data) and Abstracts Views on Vision4Press platform.
Data correspond to usage on the plateform after 2015. The current usage metrics is available 48-96 hours after online publication and is updated daily on week days.
Initial download of the metrics may take a while.