Free Access
Fig. 3
Download original image
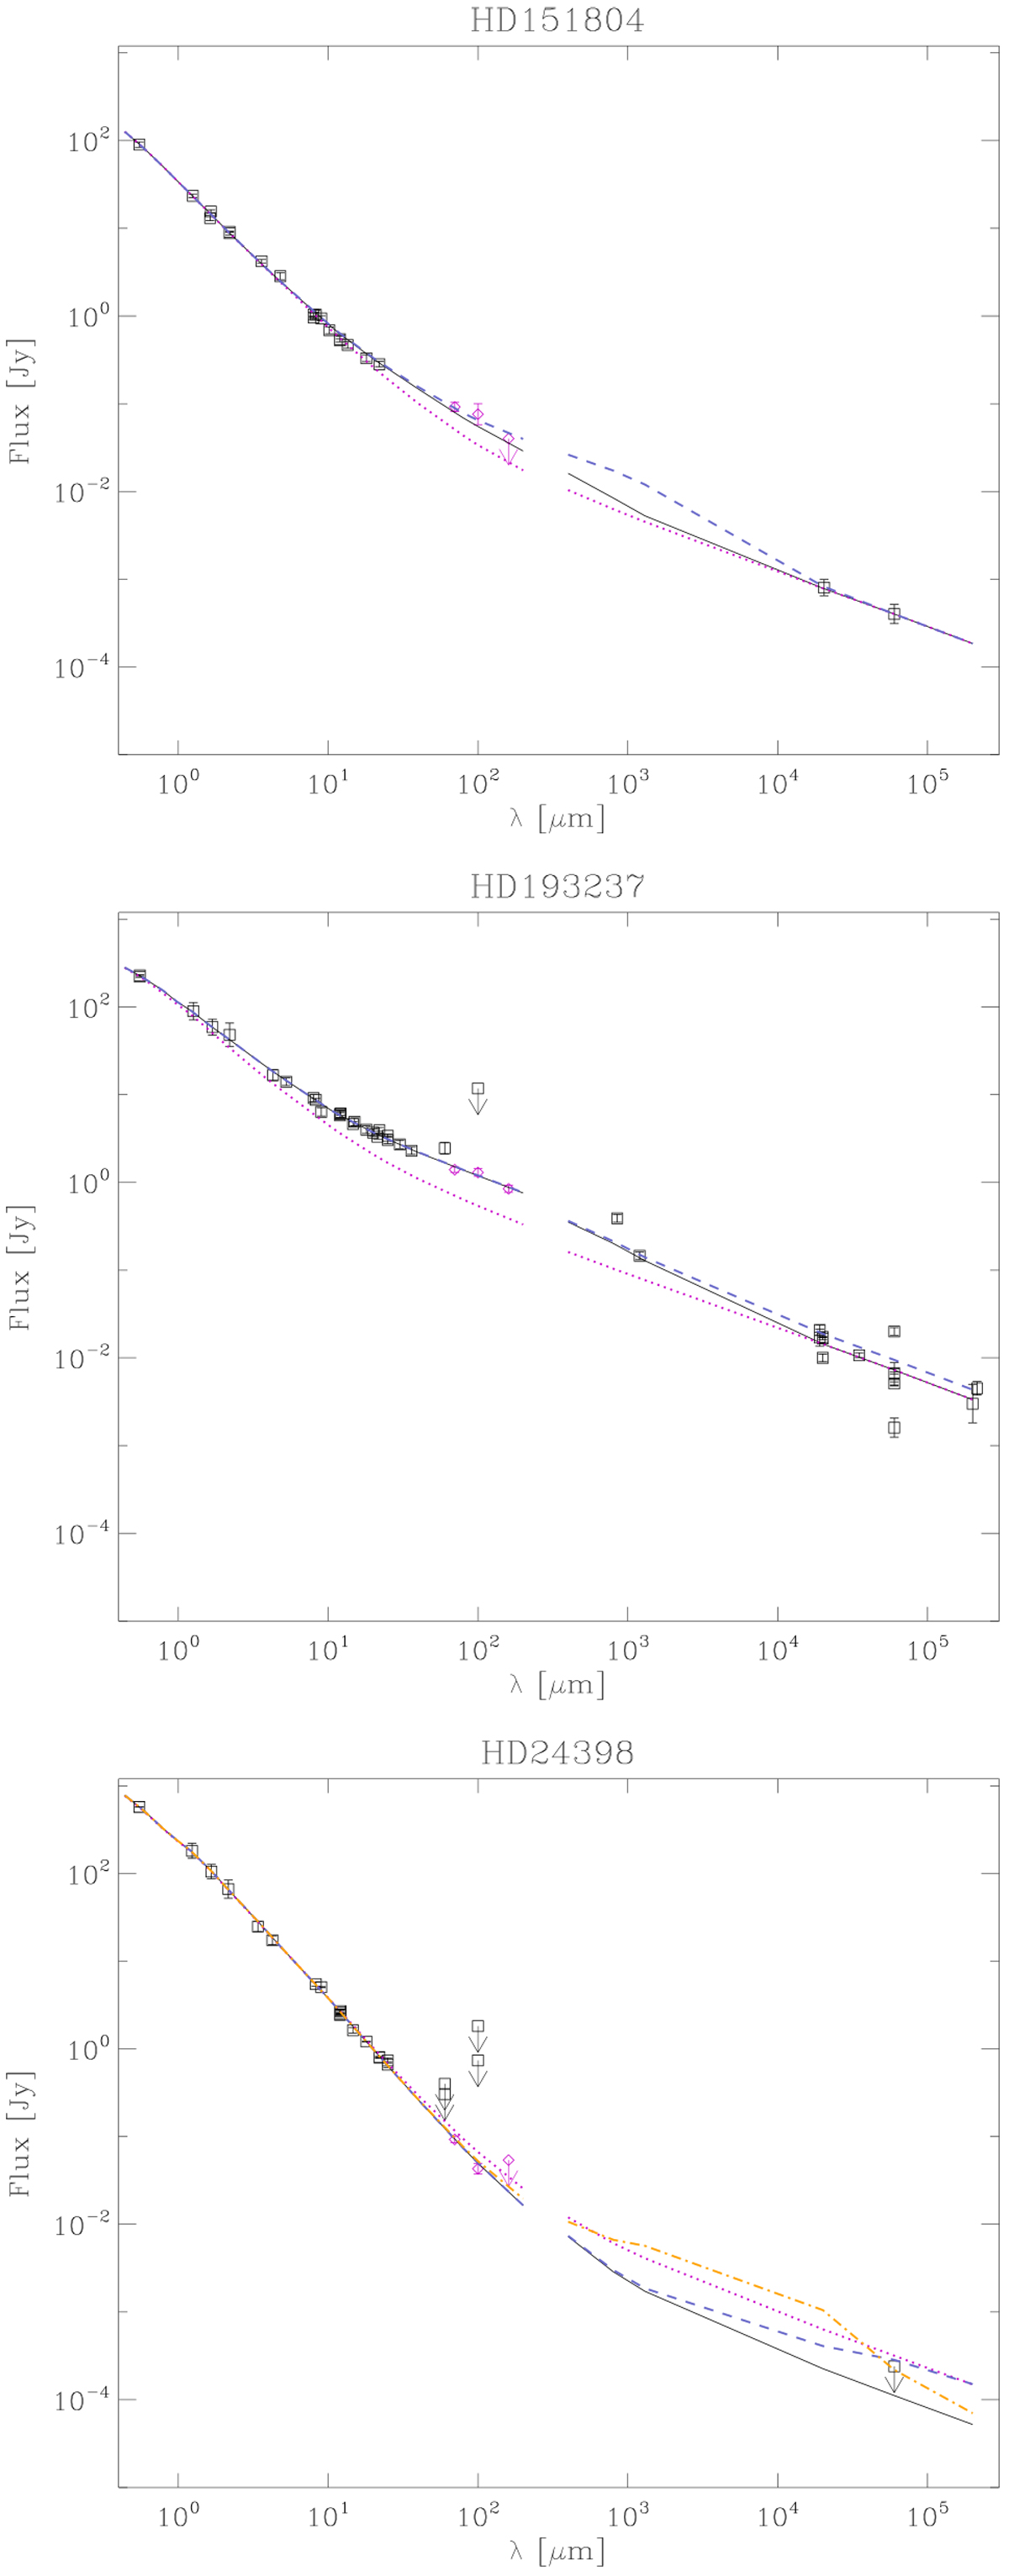
From top to bottom: observed and best-fit fluxes vs. wavelength in the fixed-regions approach for HD 151804, HD 193237 (P Cyg), and HD 24398 (ζ Per). Solid lines correspond to the best-fits; magenta-dotted, blue-dashed and orange-dashed-dotted lines correspond to different models (see text).
Current usage metrics show cumulative count of Article Views (full-text article views including HTML views, PDF and ePub downloads, according to the available data) and Abstracts Views on Vision4Press platform.
Data correspond to usage on the plateform after 2015. The current usage metrics is available 48-96 hours after online publication and is updated daily on week days.
Initial download of the metrics may take a while.