Fig. A.4
Download original image
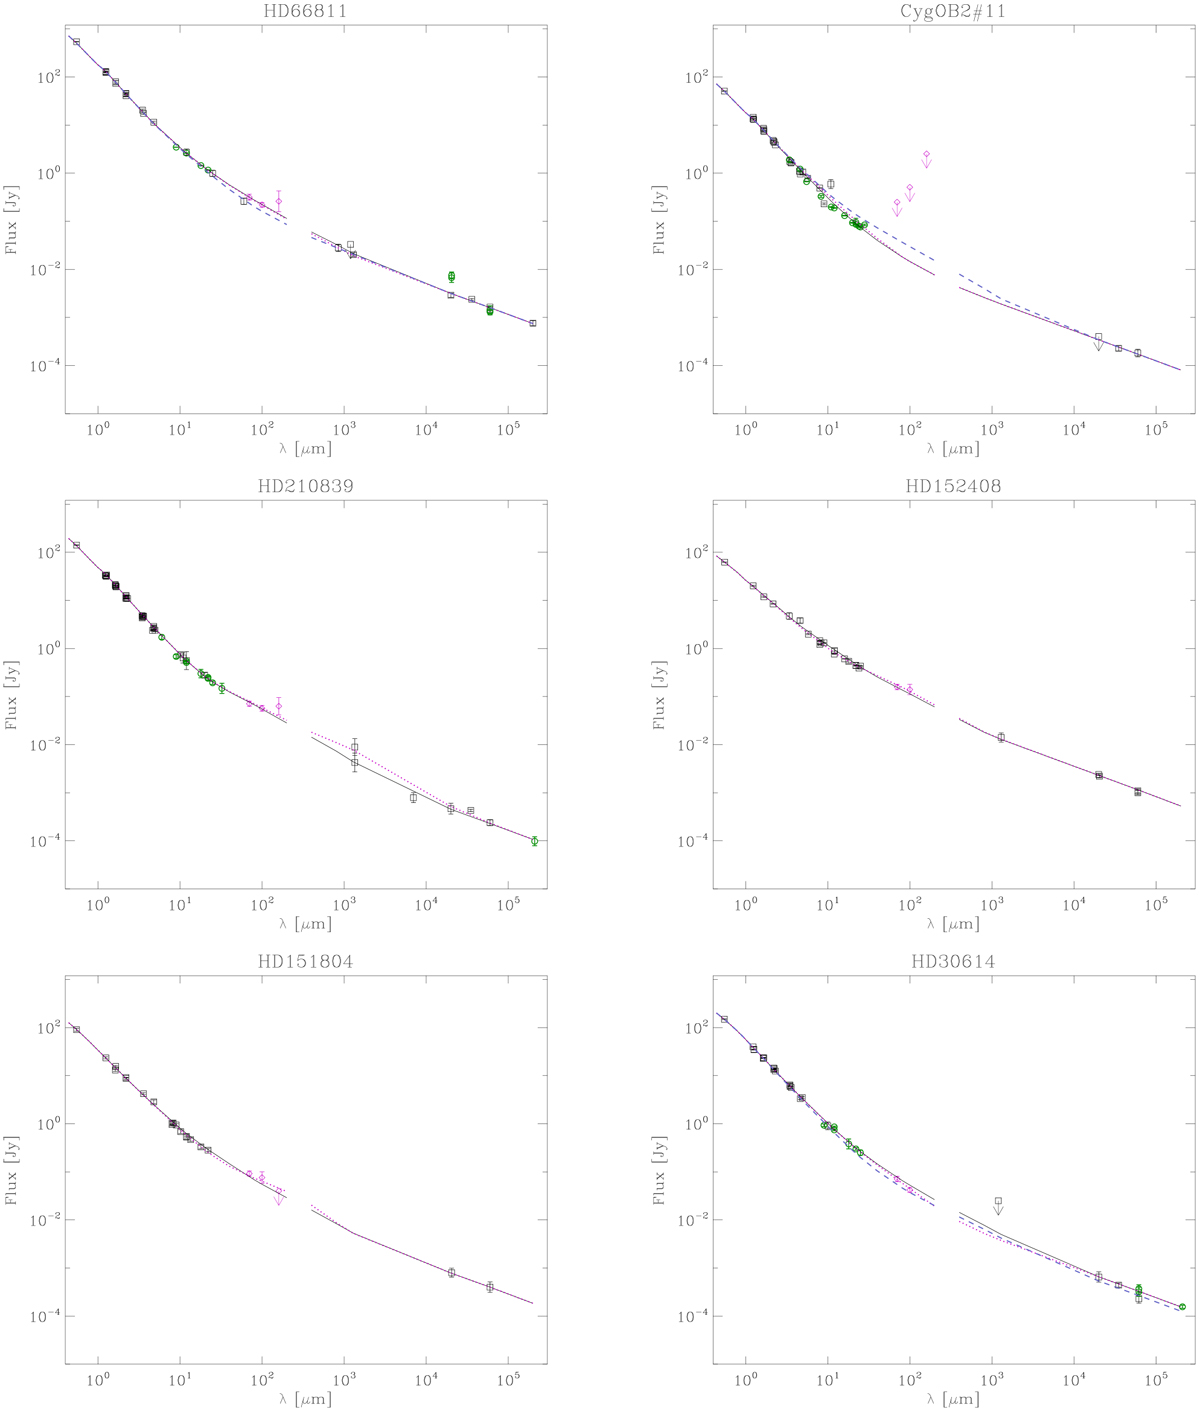
Observed and best-fit fluxes vs. wavelength for the O supergiants in our sample. Solid lines represent the best-fit model in the fixed-regions approach derived in this work (see Table 6 for parameters); magenta-dotted lines are either the best-fit solution (Adapted-regions approach; see Table 7 for parameters) or an alternate solution (see comments on individual objects in Section A.1); and blue-dashed lines correspond to existing previous best-fit models from P06. Magenta diamonds are our measured FIR fluxes at 70, 100 and 160 μm. Black squares and green circles indicate flux values from the literature. For those sources in common with P06, green circles indicate new available data added to the analysis. Arrows indicate upper limits.
Current usage metrics show cumulative count of Article Views (full-text article views including HTML views, PDF and ePub downloads, according to the available data) and Abstracts Views on Vision4Press platform.
Data correspond to usage on the plateform after 2015. The current usage metrics is available 48-96 hours after online publication and is updated daily on week days.
Initial download of the metrics may take a while.