Fig. A.2
Download original image
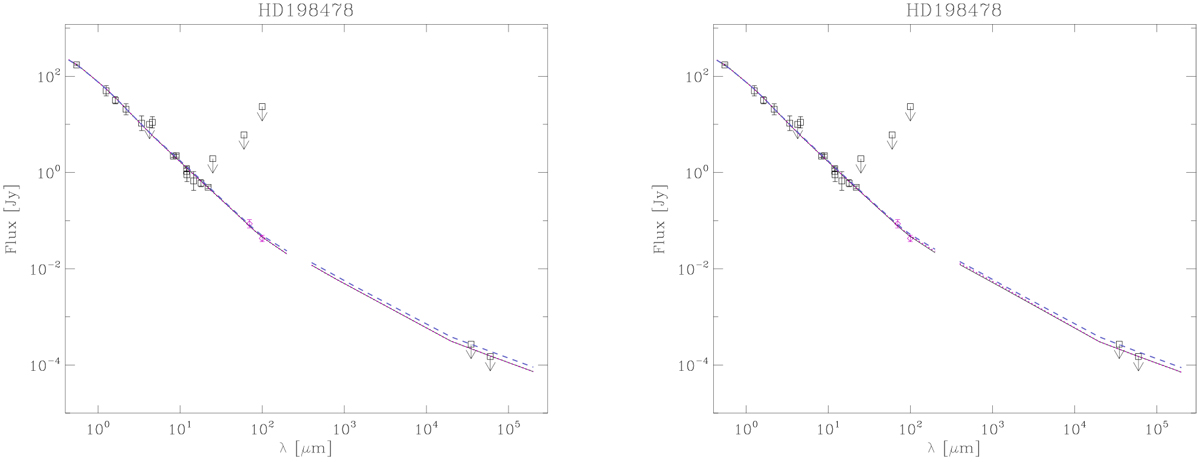
Observed and best-fit fluxes vs. wavelength for HD 198478 depending on the input parameters used in the simulations (see Table A.1 and text in Appendix A.2). Colours and symbols as in Figure A.1. Left: Best-fit models 470 kms−1 for YHe = 0.2 (solid line; Sol. 1a) and YHe = 0.1 (magenta-dotted line; Sol. 1b). Right: Best-fit models for υ∞ = 200 kms−1 for YHe = 0.2 (solid line; Sol. 2a) and YHe = 0.1 (magenta-dotted line; Sol. 2b). The blue-dashed line in both plots shows how changes in YHe are reflected in the emission flux model.
Current usage metrics show cumulative count of Article Views (full-text article views including HTML views, PDF and ePub downloads, according to the available data) and Abstracts Views on Vision4Press platform.
Data correspond to usage on the plateform after 2015. The current usage metrics is available 48-96 hours after online publication and is updated daily on week days.
Initial download of the metrics may take a while.