Fig. 9
Download original image
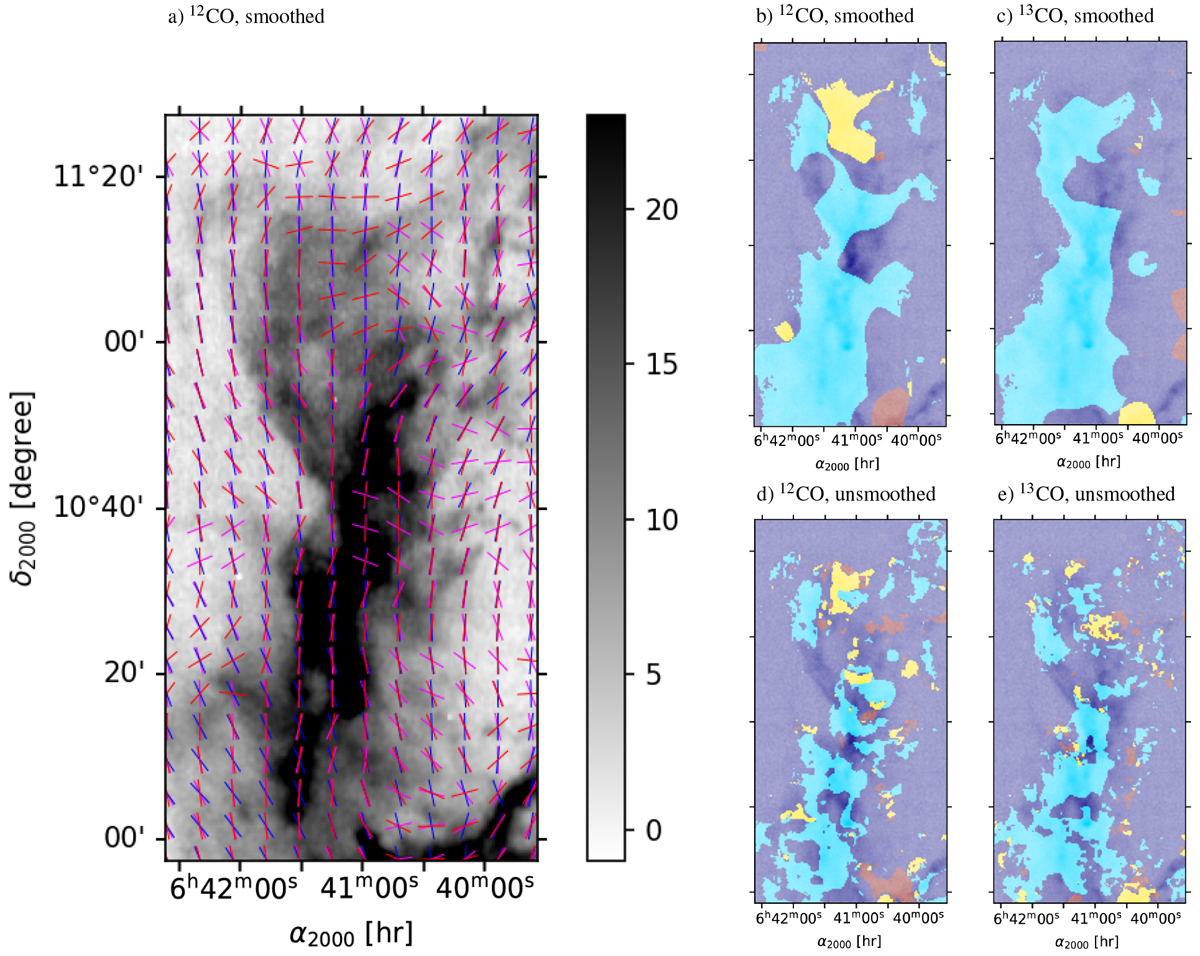
Northern part of Mon OB 1 east (corresponding to the yellow rectangle in Fig. 3) with the POS magnetic field orientation (blue segments), the orientations of the rotated velocity gradients (magenta segments), and intensity gradients (red segments) overlaid on the TRAO 12CO integrated intensity map (between vlsr = −3 to 17 km s−1) shown in panel a. In panels b–e, we show the same region. The blue shaded pattern corresponds to the regions where gravity is not dominant (case i), the red shaded pattern corresponds to the candidate collapse (case ii), the yellow shaded pattern corresponds to the candidate shock regions (case iii), overlaid on the 13CO integrated intensity grey scale map: (b) based on 12CO TRAO data smoothed to 7′ resolution, (c) based on 13CO TRAO data smoothed to 7′ resolution, (d) based on 12CO TRAO data at the resolution of 47′′, (e) based on 13CO TRAO data at the resolution of 47′′.
Current usage metrics show cumulative count of Article Views (full-text article views including HTML views, PDF and ePub downloads, according to the available data) and Abstracts Views on Vision4Press platform.
Data correspond to usage on the plateform after 2015. The current usage metrics is available 48-96 hours after online publication and is updated daily on week days.
Initial download of the metrics may take a while.