Fig. 7
Download original image
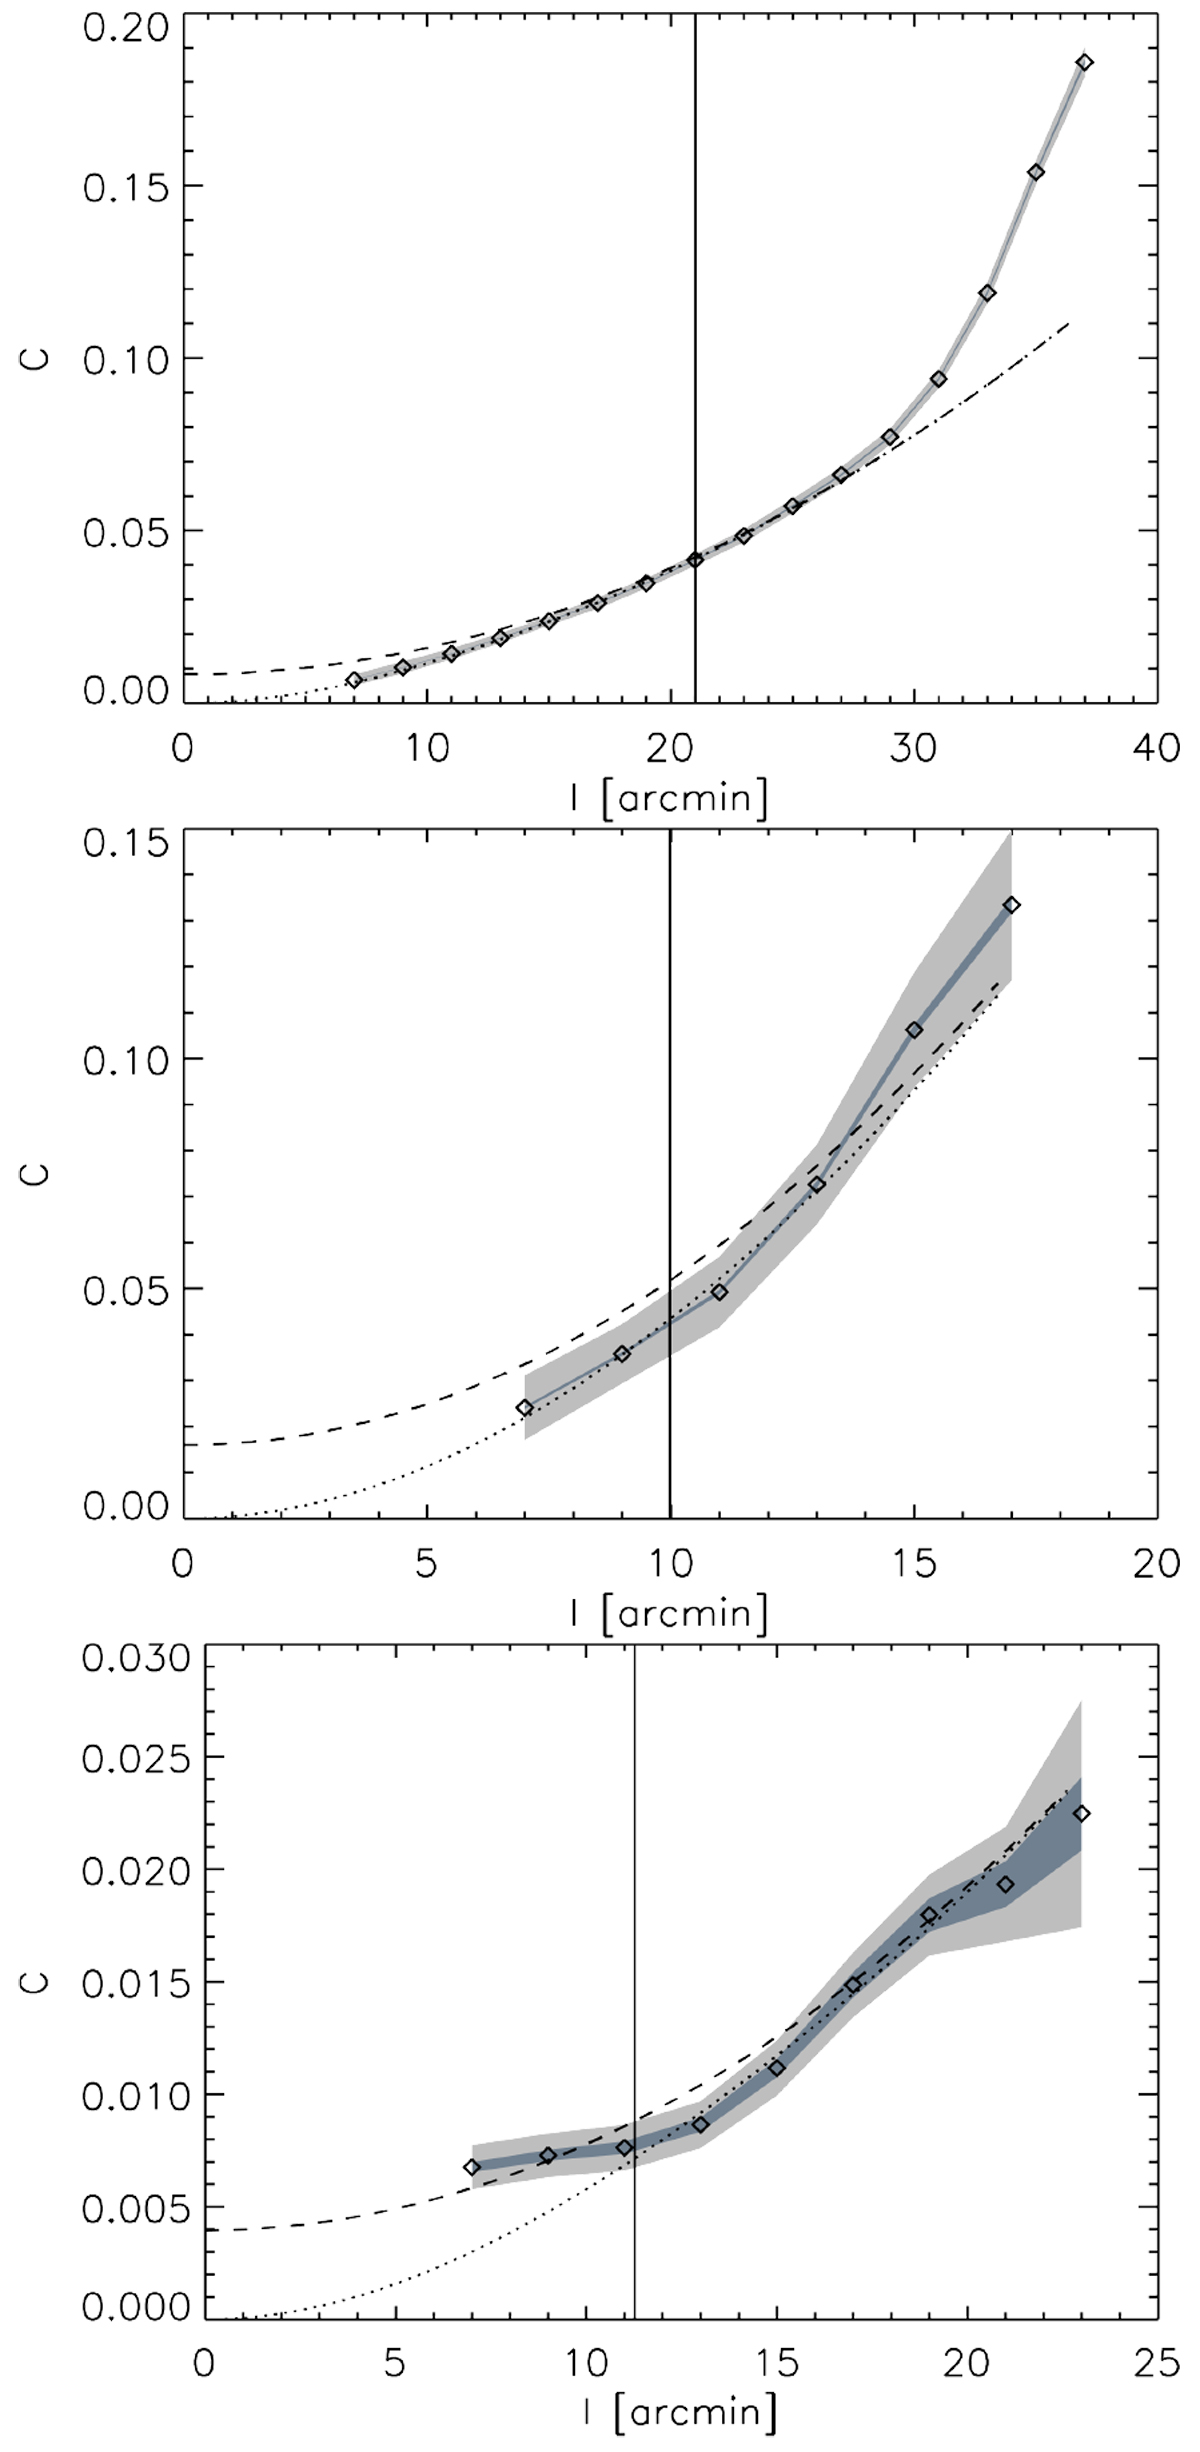
Angular dispersion functions ![]() (
(![]() ) and the corresponding fits to the data using Eq. (5) (dotted curves) for the north Main, north western, and north eastern regions from top to bottom respectively. The dashed curves show the integrated turbulent component obtained from Eq. (5) without the exponential term. The grey area shows the error estimated using Monte-Carlo simulations that take into account the noise variances of the data and the dark gray area shows the uncertainty due to the number of available pixel pairs for each lag l. The verticallines show the diameters of the purple circles from Fig. 6.
) and the corresponding fits to the data using Eq. (5) (dotted curves) for the north Main, north western, and north eastern regions from top to bottom respectively. The dashed curves show the integrated turbulent component obtained from Eq. (5) without the exponential term. The grey area shows the error estimated using Monte-Carlo simulations that take into account the noise variances of the data and the dark gray area shows the uncertainty due to the number of available pixel pairs for each lag l. The verticallines show the diameters of the purple circles from Fig. 6.
Current usage metrics show cumulative count of Article Views (full-text article views including HTML views, PDF and ePub downloads, according to the available data) and Abstracts Views on Vision4Press platform.
Data correspond to usage on the plateform after 2015. The current usage metrics is available 48-96 hours after online publication and is updated daily on week days.
Initial download of the metrics may take a while.