Fig. 6
Download original image
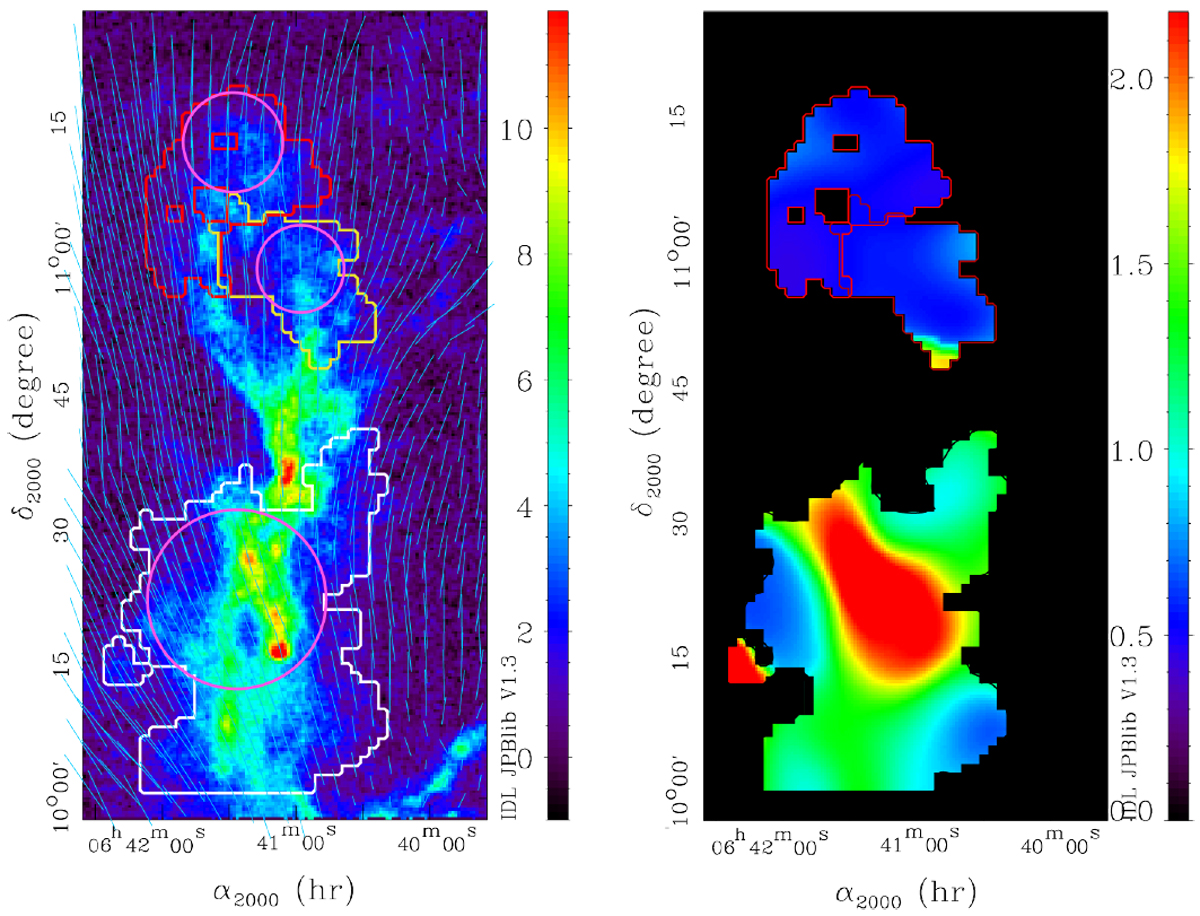
Northern part of the cloud where the magnetic field strength was estimated. Left panel: location of the north-main (white contour), north-western (yellow contour), and north-eastern (red contour) velocity coherent structures overlaid on the TRAO 13CO integrated intensity map, in K km s−1. Segments represent the POS magnetic field orientation derived from the Planck data, the length of the segments corresponds to the polarization fraction, with the reference length of 10′ corresponding to p = 0.05. Right panel: velocity dispersion in the three subregions from the 13CO emission TRAO data, smoothed to 7′ resolution, in km s−1. Purple circles correspond to the largest circles inscribed in the area of each VCS.
Current usage metrics show cumulative count of Article Views (full-text article views including HTML views, PDF and ePub downloads, according to the available data) and Abstracts Views on Vision4Press platform.
Data correspond to usage on the plateform after 2015. The current usage metrics is available 48-96 hours after online publication and is updated daily on week days.
Initial download of the metrics may take a while.