Fig. 10
Download original image
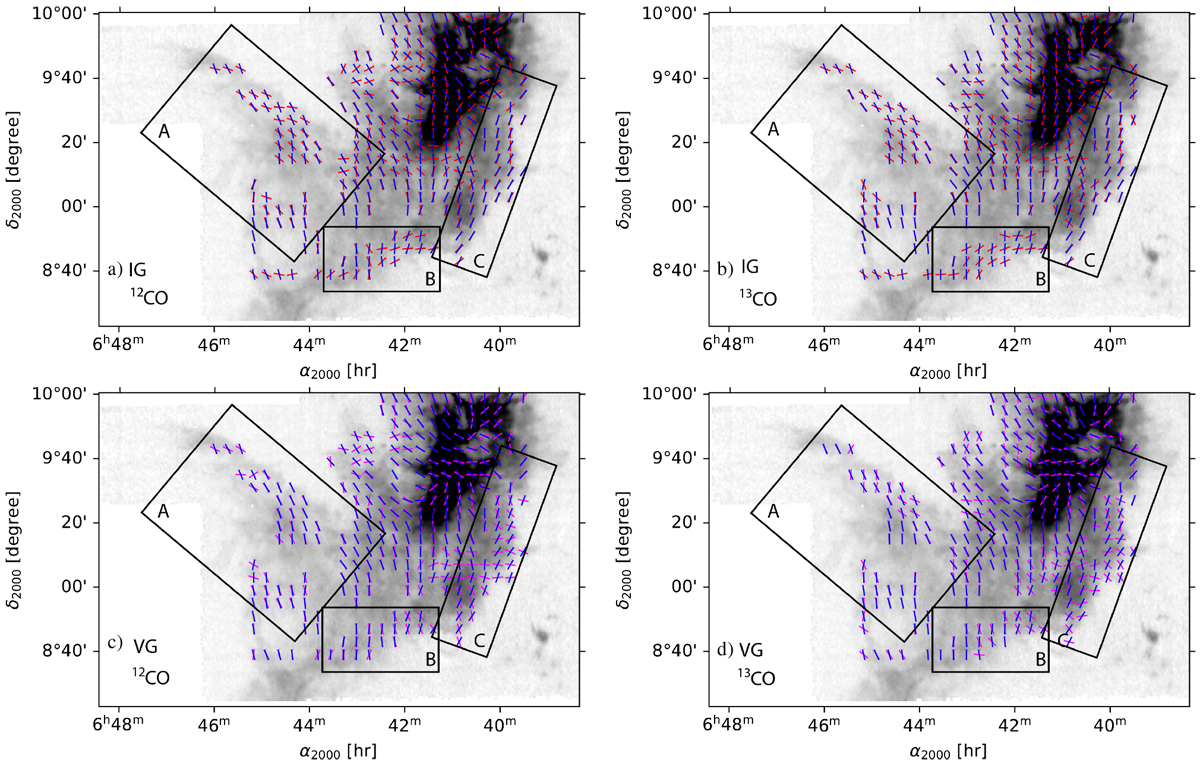
Southern part of Mon OB 1 east (corresponding to the red box in Fig. 3) with the POS magnetic field orientation represented by the blue segments, overlaid on the TRAO 12CO integrated intensity gray-scale map. Top row: red segments show the orientation of the rotated intensity gradients based on the 12CO and 13CO tracers (panels a and b respectively). Bottom row: magenta segments show the orientation of the rotated velocity gradients based on the 12CO and 13CO tracers (c and d respectively).
Current usage metrics show cumulative count of Article Views (full-text article views including HTML views, PDF and ePub downloads, according to the available data) and Abstracts Views on Vision4Press platform.
Data correspond to usage on the plateform after 2015. The current usage metrics is available 48-96 hours after online publication and is updated daily on week days.
Initial download of the metrics may take a while.