Fig. 9.
Download original image
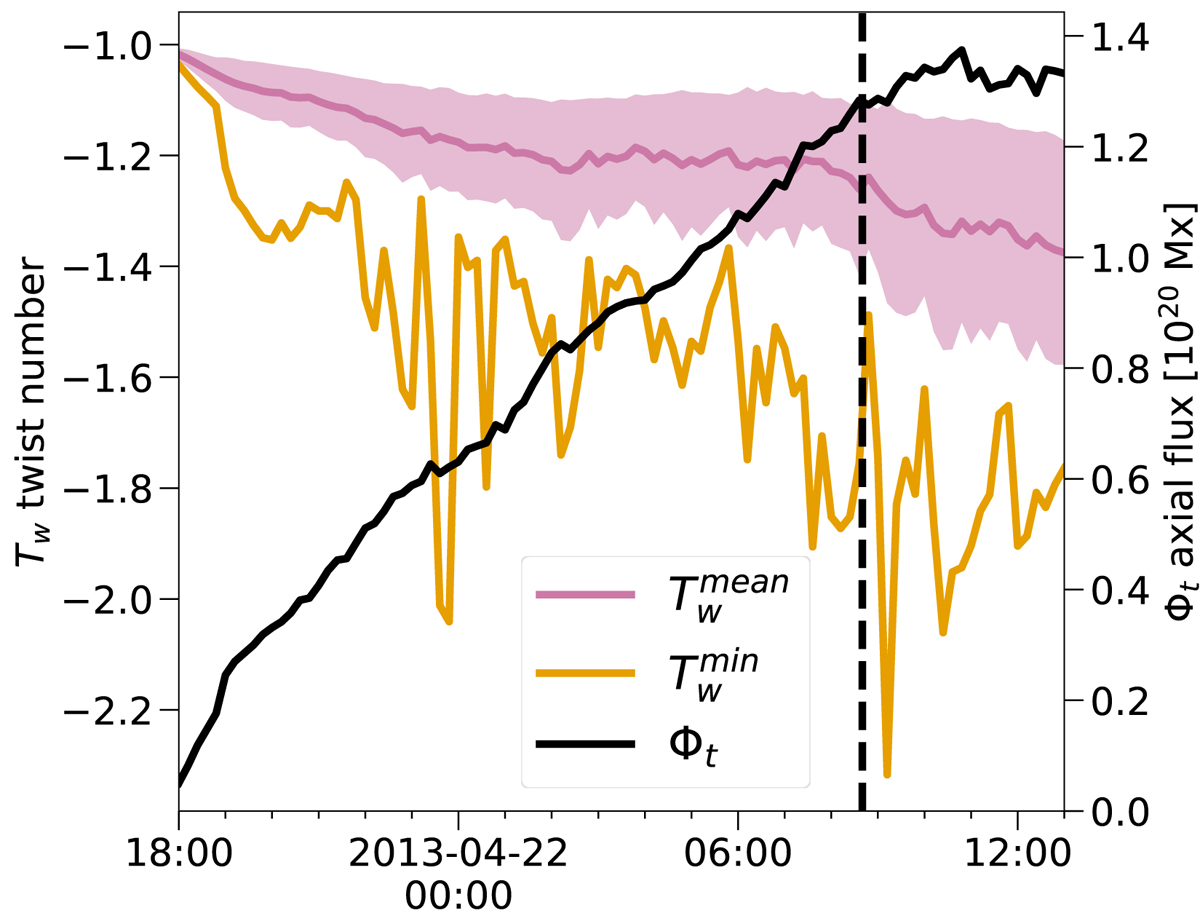
Time evolution of mean and minimum twist numbers ![]() ,
, ![]() and the axial flux Φt in the main FR between 21 April 18:00 UT and 22 April 13:00 UT. The shaded region around the purple
and the axial flux Φt in the main FR between 21 April 18:00 UT and 22 April 13:00 UT. The shaded region around the purple ![]() illustrates the
illustrates the ![]() range, σ(Tw) being the standard deviation of the Tw in the main FR. The vertical dashed line shows the initiation time of the observed eruption on 22 April 2013 at 08:40 UT.
range, σ(Tw) being the standard deviation of the Tw in the main FR. The vertical dashed line shows the initiation time of the observed eruption on 22 April 2013 at 08:40 UT.
Current usage metrics show cumulative count of Article Views (full-text article views including HTML views, PDF and ePub downloads, according to the available data) and Abstracts Views on Vision4Press platform.
Data correspond to usage on the plateform after 2015. The current usage metrics is available 48-96 hours after online publication and is updated daily on week days.
Initial download of the metrics may take a while.