Fig. 6.
Download original image
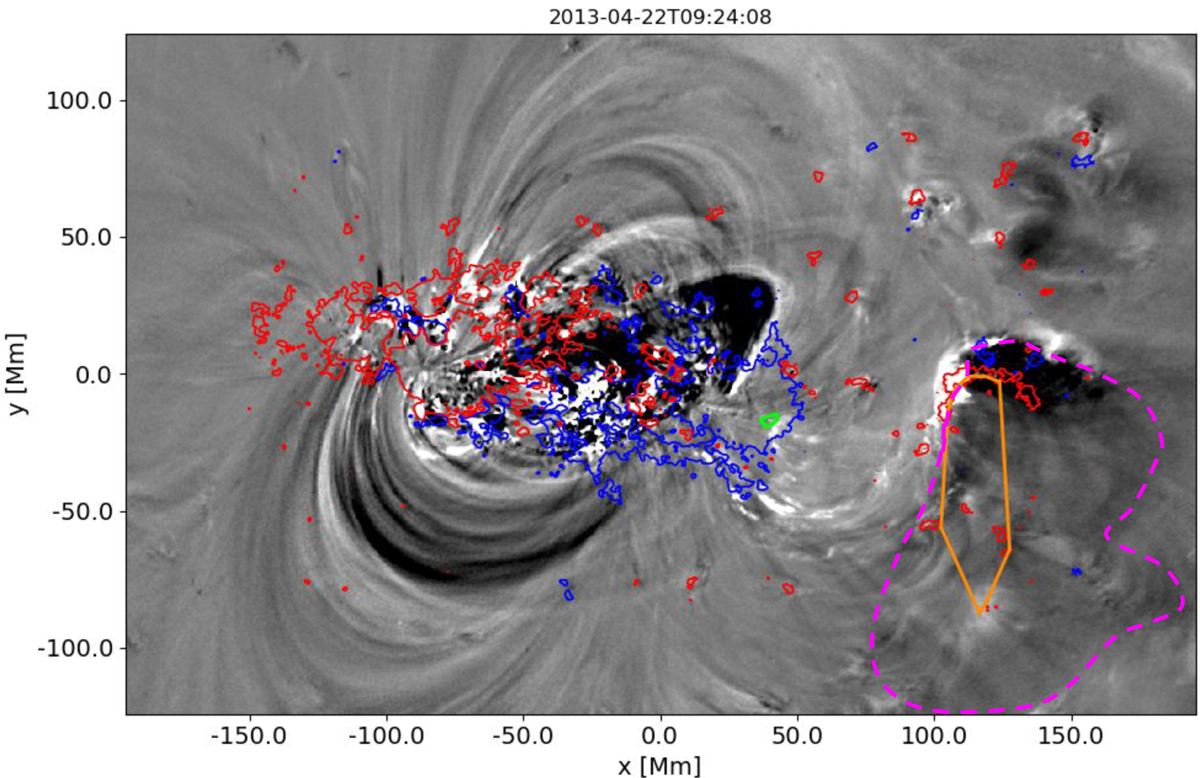
Base difference image between AIA 193 Å observations on 22 April at 08:24 UT and 09:24 UT. The AIA images are re-projected onto the local Cartesian coordinates of the re-projected magnetogram series forming the bottom of the simulation box (Sect. 3.2 and Fig. 1). The blue and red contours correspond to the −100 and 100 Mx cm−2 contours of the photospheric Bz magnetic field component, respectively. The lime and orange curves enclose the approximate position of the negative- and positive-polarity footpoints, respectively, of the pre-eruptive flux rope system (both main and intertwined FRs) at 08:36 UT, determined from the simulation. The magenta dashed curve encloses the dimming region that includes the negative-polarity footpoints of the FR system. An animated version of this figure can be found online.
Current usage metrics show cumulative count of Article Views (full-text article views including HTML views, PDF and ePub downloads, according to the available data) and Abstracts Views on Vision4Press platform.
Data correspond to usage on the plateform after 2015. The current usage metrics is available 48-96 hours after online publication and is updated daily on week days.
Initial download of the metrics may take a while.