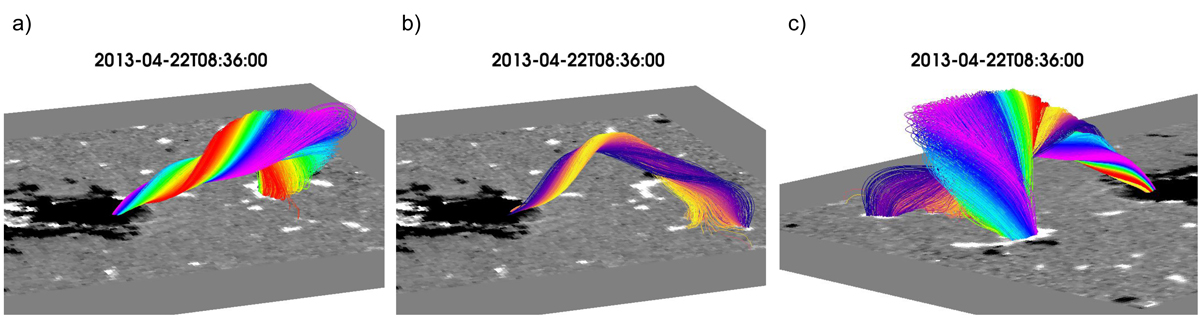
Fig. 5.
Download original image
Simulated field lines of flux rope system identified from the current density, squashing factor and twist maps at the x = 76 Mm plane on 22 April 2013 at 08:36 UT, just before the onset of the observed eruption at from 08:40 UT onwards (Sect. 2.2). Panel a: main FR field lines viewed from the southeast. The lines are rainbow-colored based on the seed point position of the lines at the x = 76 Mm plane. The Bz magnetic field component is plotted at the photospheric z = 0 lower boundary of the simulation domain in black-white coloring saturated at ±100 Mx cm−2 (=0.01 T). Panel b: intertwined FR with yellow-purple coloring. Panel c: both FRs viewed from the northwest. All plotted field lines are based on finding a coherent region on the x = 76 Mm plane where the condition [(log10Q ≤ 1.5)∧(Tw ≤ −1)] is fulfilled. Animated versions of each panel can be found online. For panels a and b, online movies 3 and 4 also offer the view from the northwest, as in panel c.
Current usage metrics show cumulative count of Article Views (full-text article views including HTML views, PDF and ePub downloads, according to the available data) and Abstracts Views on Vision4Press platform.
Data correspond to usage on the plateform after 2015. The current usage metrics is available 48-96 hours after online publication and is updated daily on week days.
Initial download of the metrics may take a while.