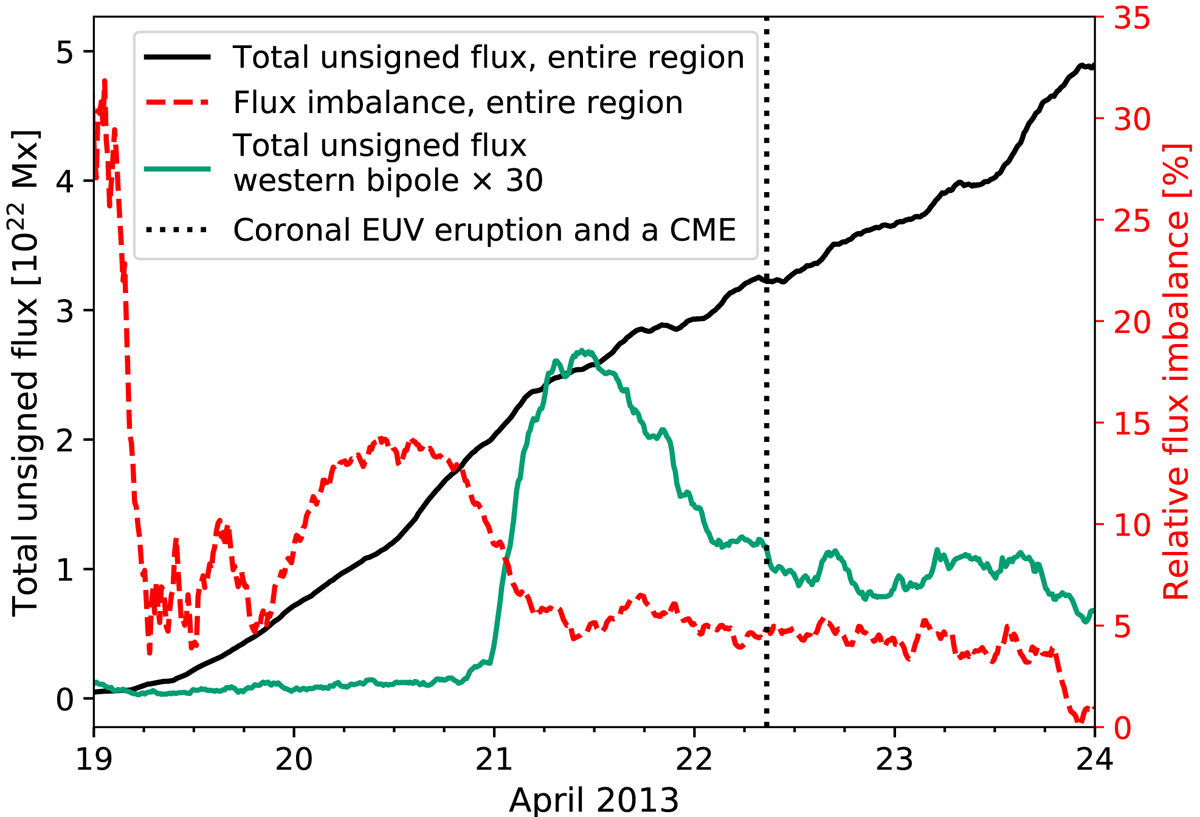
Fig. 2.
Download original image
Evolution of total unsigned magnetic flux and flux imbalance in NOAA AR 11726 derived from the processed and re-projected SDO/HMI Bz magnetogram series (Sect. 3.2), where the pixels |B|< 250 Mx cm−2 were masked to zero to avoid spurious effects arising from the noise-dominated weak-field pixels. The black curve shows the evolution of the unsigned flux over the entire active region patch, whereas the green curve shows the unsigned flux evolution of the small western bipole (see Fig. 1) multiplied by a factor of 30 to make its scale comparable to the unsigned flux of the entire active region. The red dashed curve shows the relative flux imbalance of the active region. The vertical dotted line shows the time of the weak CME eruption of 22 April 2013, 08:40 UT that we focus on in this study.
Current usage metrics show cumulative count of Article Views (full-text article views including HTML views, PDF and ePub downloads, according to the available data) and Abstracts Views on Vision4Press platform.
Data correspond to usage on the plateform after 2015. The current usage metrics is available 48-96 hours after online publication and is updated daily on week days.
Initial download of the metrics may take a while.