Fig. 13.
Download original image
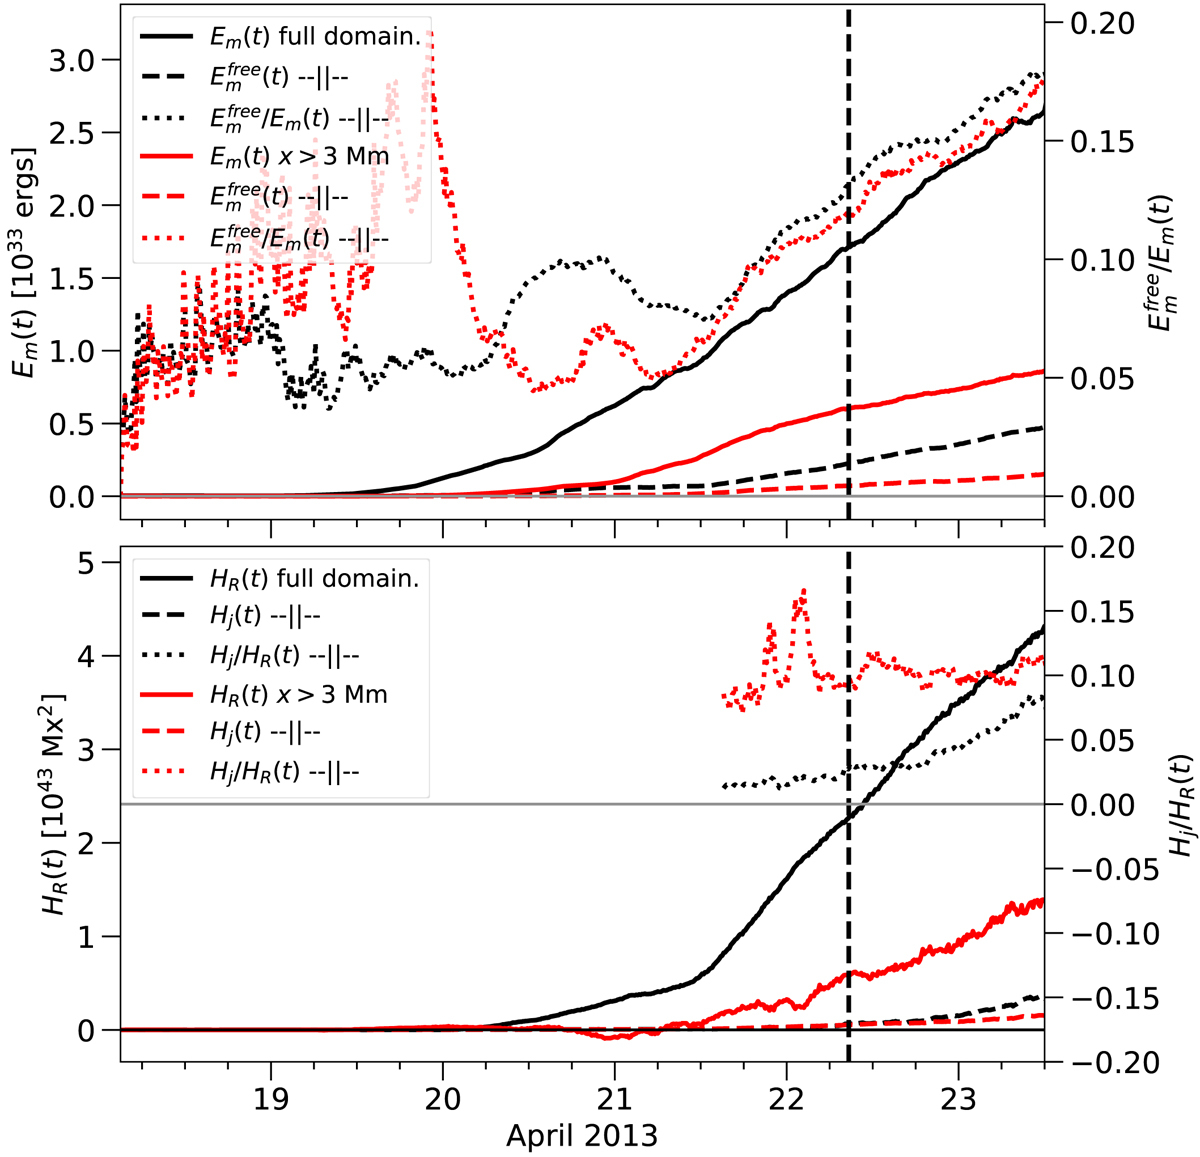
Coronal energy (upper panel) and helicity (lower panel) budgets and non-potentiality ratios (see the text for details) for the default simulation computed both in the entire domain (black curves), and in the western region x > 3 Mm enclosing the FR system of interest (red curves). Solid curves show the total budgets for three of our simulations (see text for details). Dashed line shows the non-potential component of the total budget (either ![]() or Hj), and the dotted lines show the non-potentiality ratios (
or Hj), and the dotted lines show the non-potentiality ratios (![]() and Hj/HR). Hj/HR is not plotted before 21 April 2013, 15:00 UT, as it exhibits erratic variations during that time arising from the low HR values. Horizontal solid lines show the zeroes of the y-axes and the vertical dashed line shows the time of the eruption on 22 April 2013 at 08:40 UT.
and Hj/HR). Hj/HR is not plotted before 21 April 2013, 15:00 UT, as it exhibits erratic variations during that time arising from the low HR values. Horizontal solid lines show the zeroes of the y-axes and the vertical dashed line shows the time of the eruption on 22 April 2013 at 08:40 UT.
Current usage metrics show cumulative count of Article Views (full-text article views including HTML views, PDF and ePub downloads, according to the available data) and Abstracts Views on Vision4Press platform.
Data correspond to usage on the plateform after 2015. The current usage metrics is available 48-96 hours after online publication and is updated daily on week days.
Initial download of the metrics may take a while.