Fig. 10.
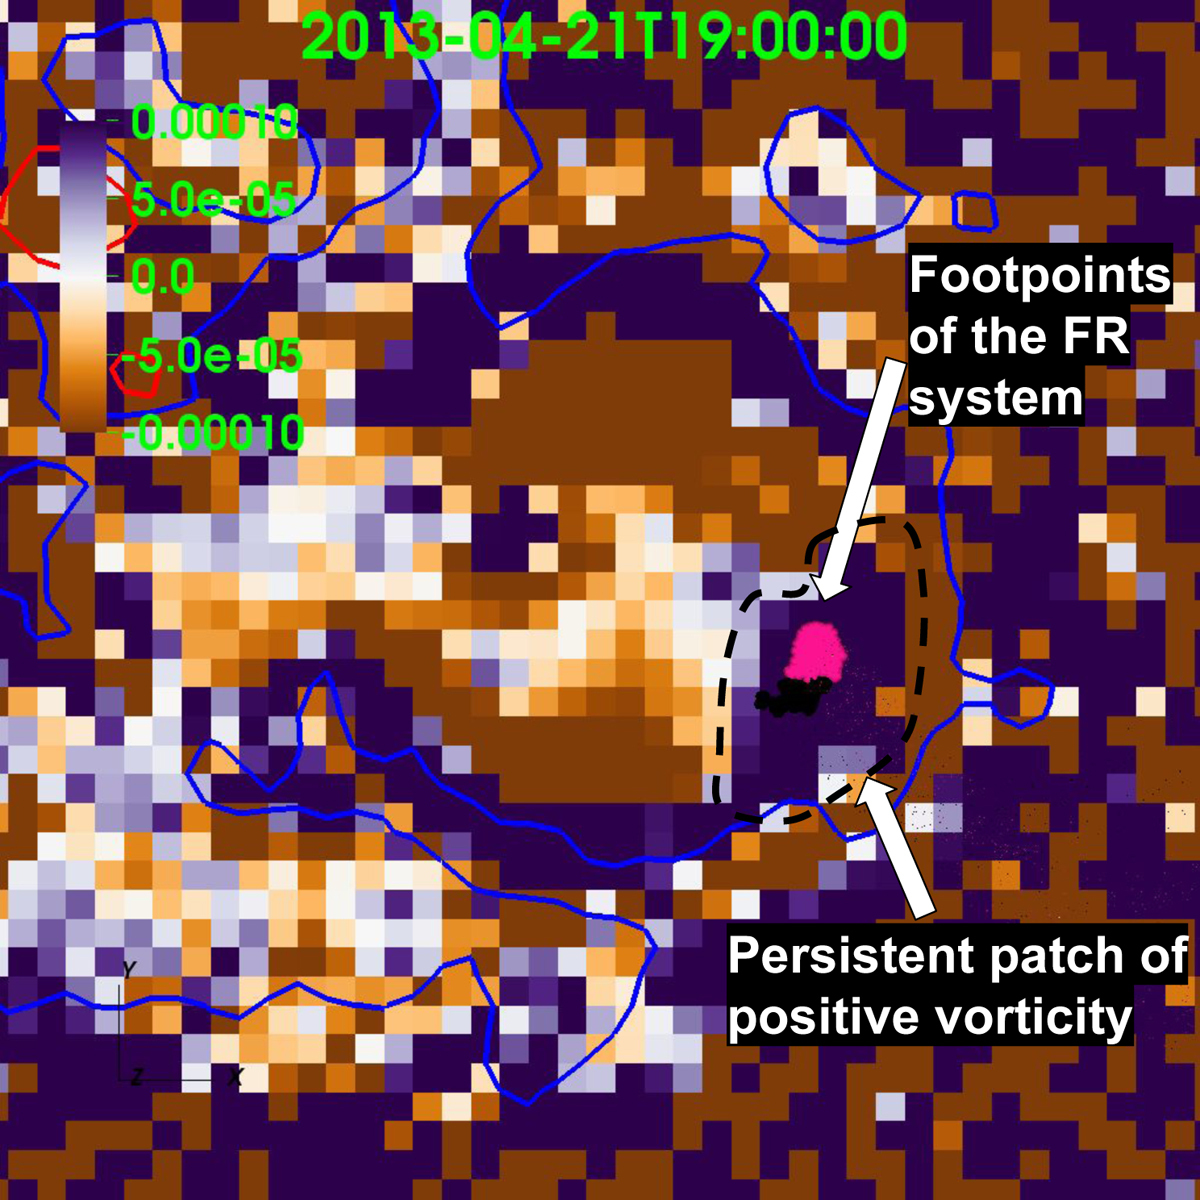
Download original image
Map of vertical component of vorticity (∇×Vh, ⊥)⋅ez (orange-to-purple color scale, saturated at ±10−4 s−1) near the negative footpoints of the main FR (pink dots) and the intertwined FR (black dots) within the western sunspot (see Fig. 1) during the formation processes of the FRs on 21 April 2013 at 19:00 UT. The blue and red contours correspond to the photospheric Bz of ±100 Mx cm−2 (blue for negative). The black dashed curve encloses a persistent patch of positive vorticity that encloses the FR footpoints. An animated version of this figure is available online.
Current usage metrics show cumulative count of Article Views (full-text article views including HTML views, PDF and ePub downloads, according to the available data) and Abstracts Views on Vision4Press platform.
Data correspond to usage on the plateform after 2015. The current usage metrics is available 48-96 hours after online publication and is updated daily on week days.
Initial download of the metrics may take a while.