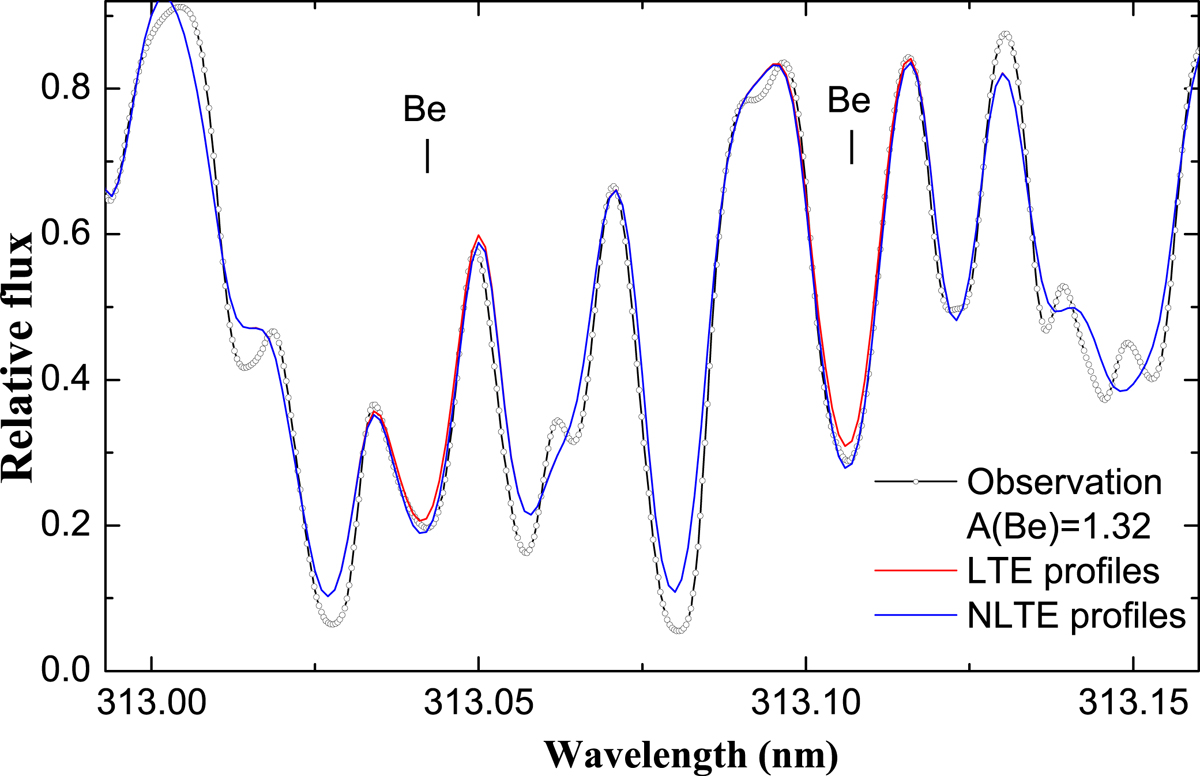
Fig. 2.
Download original image
Observed solar spectrum from the Kurucz atlas (dots) and the best-fitted synthetic SynthV spectra (solid lines) in the vicinity of Be II lines. The solid blue line denotes a synthetic spectrum with the Be II lines computed in NLTE and the remaining lines in LTE. Solid red lines are Be II profiles computed in LTE with the same Be abundance.
Current usage metrics show cumulative count of Article Views (full-text article views including HTML views, PDF and ePub downloads, according to the available data) and Abstracts Views on Vision4Press platform.
Data correspond to usage on the plateform after 2015. The current usage metrics is available 48-96 hours after online publication and is updated daily on week days.
Initial download of the metrics may take a while.