Fig. 3.
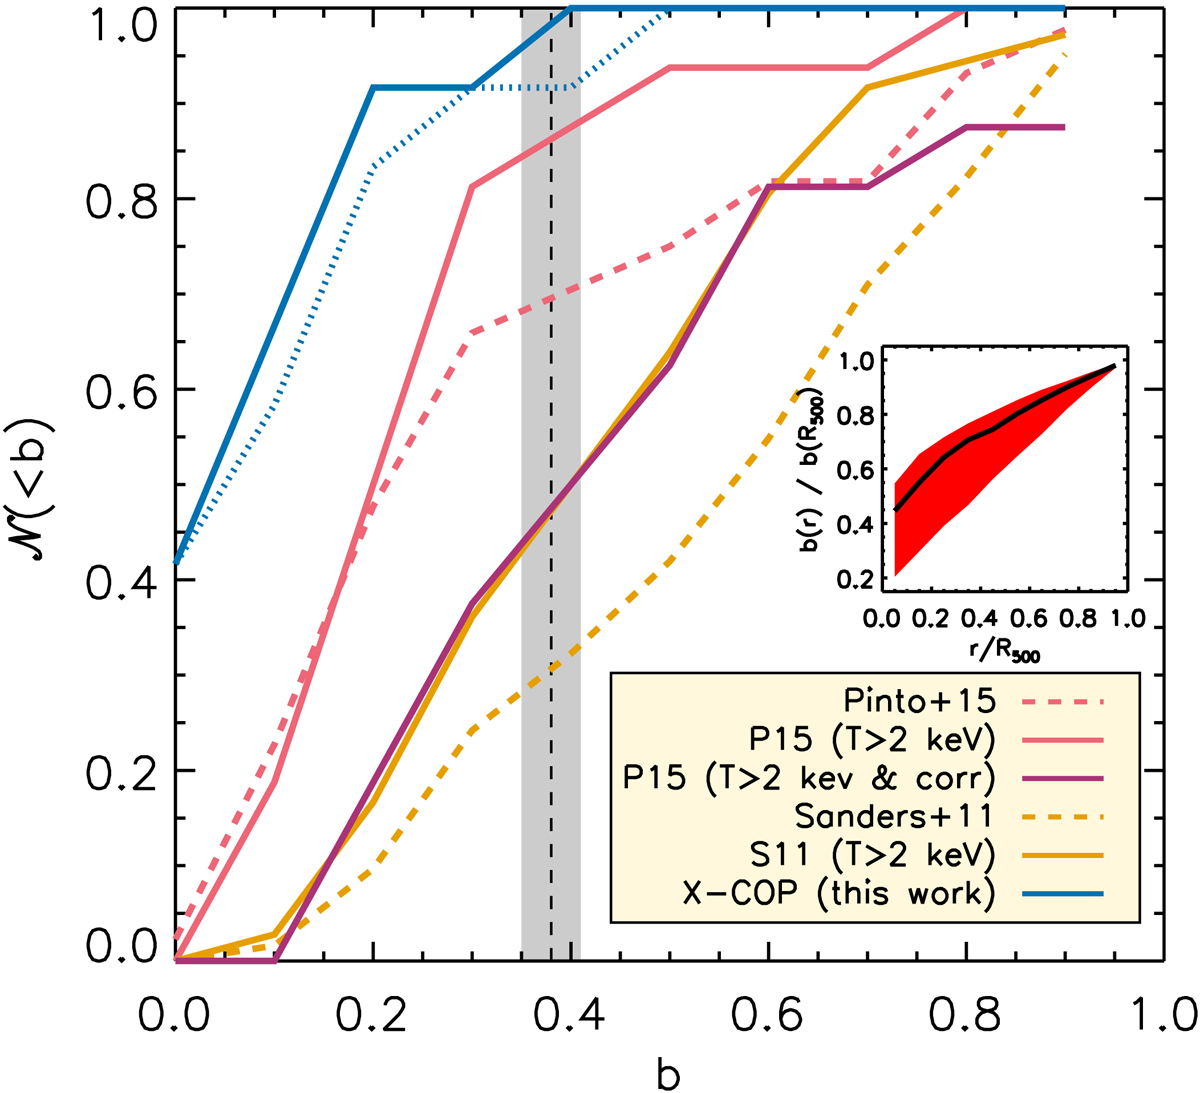
Download original image
Density distribution of the hydrostatic bias, b. The values of b are inferred from Eq. (10), using the values tabulated in Table 1, for the X-COP objects at R500 (solid line) and at R200 (dotted line), and from Eq. (24) for the upper limits for the clusters in Pinto et al. (2015) (16 out of 44 with T > 2 keV; upper limits estimated within 0.8 arcmin) and Sanders et al. (2011) (36 out of 62). The purple line shows the constraints that include the correction to extrapolate the estimates from the core to R500 (see text and the inset, where we plot median distribution, with first and third quartiles, of the hydrostatic bias in the X-COP sample as a function of radius). The shaded region shows the constraints obtained from the Planck Collaboration by combining the cosmic microwave background anisotropies and the cluster number count (Planck Collaboration VI 2020).
Current usage metrics show cumulative count of Article Views (full-text article views including HTML views, PDF and ePub downloads, according to the available data) and Abstracts Views on Vision4Press platform.
Data correspond to usage on the plateform after 2015. The current usage metrics is available 48-96 hours after online publication and is updated daily on week days.
Initial download of the metrics may take a while.