Fig. 2.
Download original image
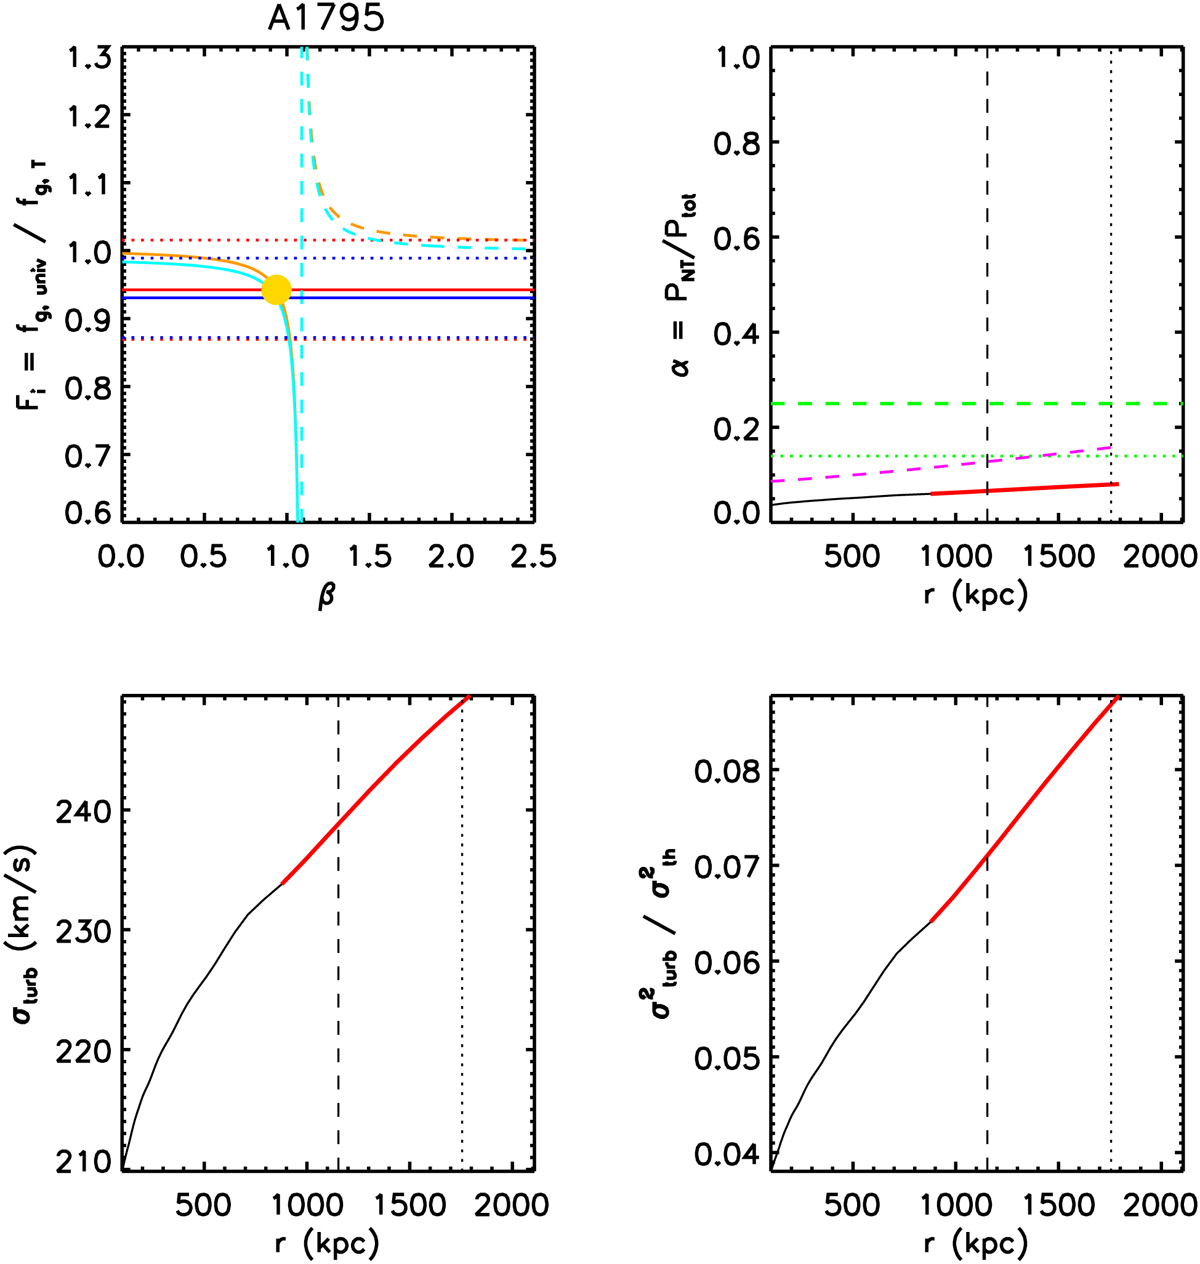
Example of the analysis applied to A1795. Upper left: distribution of the ratio of the expected gas fraction (the dashed orange line represents R500 and dashed cyan R200) and observed gas fraction, Fi (solid horizontal lines, with errors represented by dotted lines; red represents R500 and blue R200) as a function of the slope, β (see Eq. (16)); the best-fit value is indicated by the yellow dot. Upper right: distribution of α as a function of radius with, overplotted in purple, the prediction from the model of αturb in Angelinelli et al. (2020) and the expectations on the level of turbulence assuming η = 1/3 (green dashed line) and magnetic energy CE = 0.05 (green dotted line; see Sect. 4 for details). Lower left: distribution of the turbulent velocity as a function of radius (see Eq. (22)). Lower right: distribution of the relative energy (Eq. (23)) as a function of radius. In red, we show the region used to constrain γ; R500 and R200 are indicated with vertical dashed and dotted lines.
Current usage metrics show cumulative count of Article Views (full-text article views including HTML views, PDF and ePub downloads, according to the available data) and Abstracts Views on Vision4Press platform.
Data correspond to usage on the plateform after 2015. The current usage metrics is available 48-96 hours after online publication and is updated daily on week days.
Initial download of the metrics may take a while.