Free Access
Fig. 5
Download original image
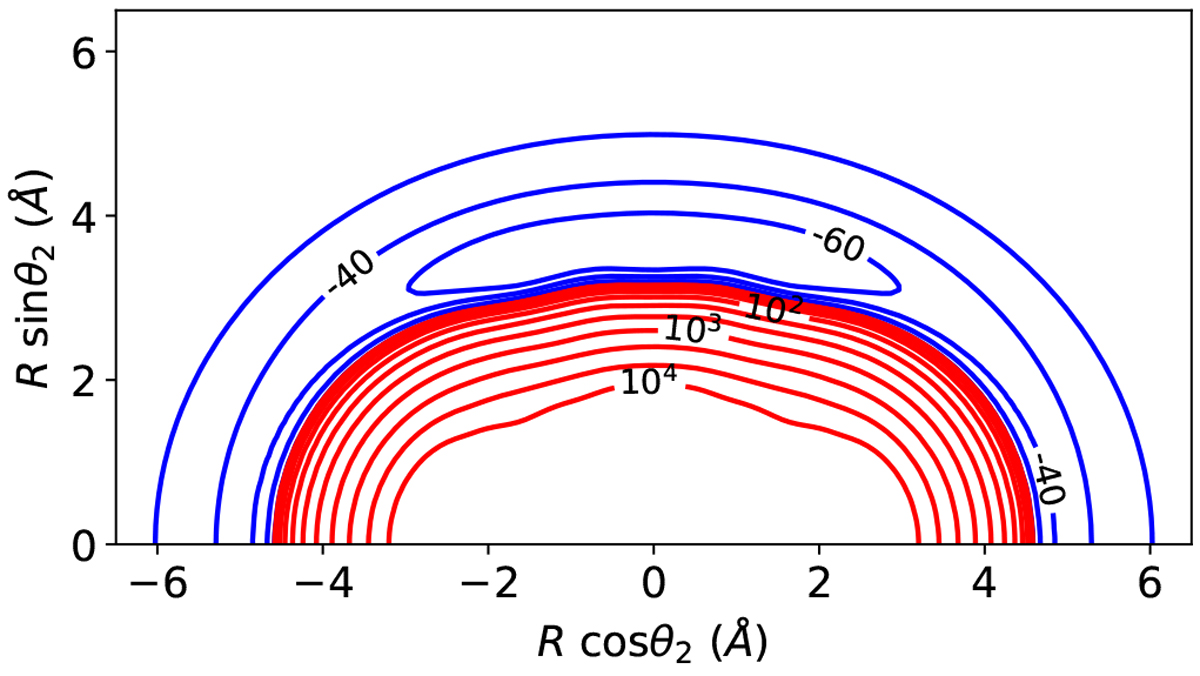
Contour plot for the averaged PES of the C3 + H2 complexcomputed from Eq. (5). The space between blue lines is 20 cm−1 in the range [−70, 0] cm−1, and the red lines are logarithmically spaced between 1 cm−1 and 104 cm−1.
Current usage metrics show cumulative count of Article Views (full-text article views including HTML views, PDF and ePub downloads, according to the available data) and Abstracts Views on Vision4Press platform.
Data correspond to usage on the plateform after 2015. The current usage metrics is available 48-96 hours after online publication and is updated daily on week days.
Initial download of the metrics may take a while.