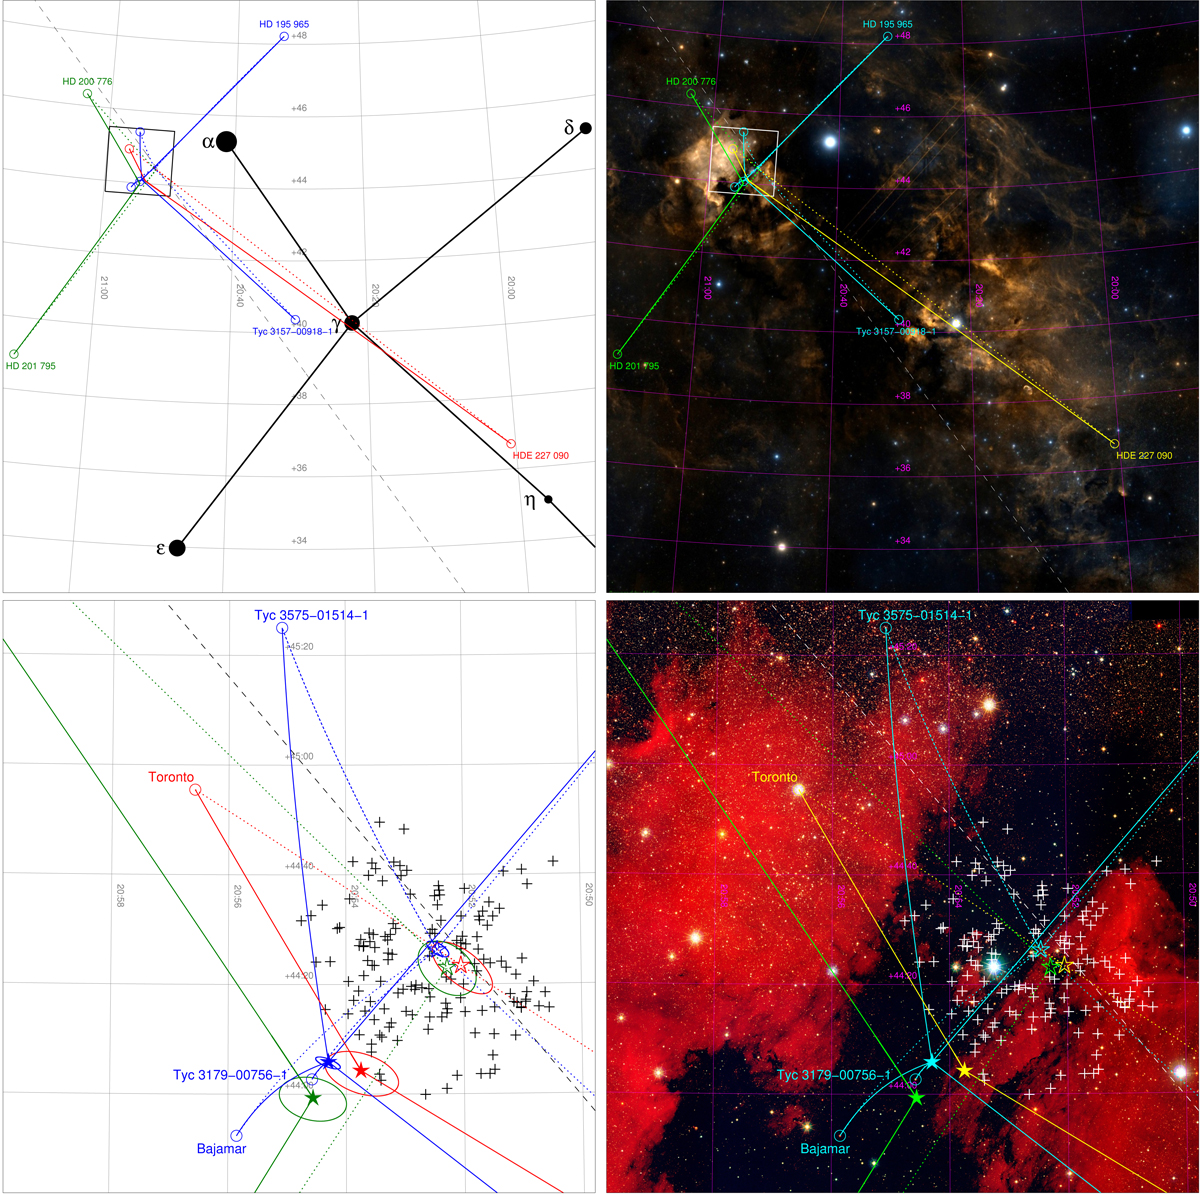
Fig. 1.
Download original image
Top left: chart in equatorial coordinates of the three ejection events in this paper, color-coded in blue (Bajamar), red (Toronto), and dark green (HD 201 795). Colored solid lines show a representative trajectory for each system in the Sun’s LSR and colored short-dashed lines the equivalent after subtracting the motion of the Bermuda cluster. The black long-dashed line shows the Galactic equator and the square indicates the location of the bottom panels. The Cygnus asterism is also plotted for reference. Top right: DSS2 image of the same field as the top left panel. Trajectories are color-coded here in cyan (Bajamar), yellow (Toronto), and green (HD 201 795). Bottom left: equivalent chart of the square region in the top panels. Stars mark the location of each event in the Sun’s LSR (filled) and after subtracting the motion of the Bermuda cluster (non-filled). The ellipses mark the corresponding two-sigma uncertainty regions of each event using Gaussian weights. The black long-dashed line shows the Galactic equator and the black crosses mark the cluster members from Villafranca II. Bottom right: GALANTE (Maíz Apellániz et al. 2021a) three-color mosaic (red: F861M+F660N, green: F665N+F515N, blue: F450N+F420N) image of the same field as the bottom-left panel. The slight curvature of the trajectories is caused by the Galactic potential.
Current usage metrics show cumulative count of Article Views (full-text article views including HTML views, PDF and ePub downloads, according to the available data) and Abstracts Views on Vision4Press platform.
Data correspond to usage on the plateform after 2015. The current usage metrics is available 48-96 hours after online publication and is updated daily on week days.
Initial download of the metrics may take a while.