Fig. 6
Download original image
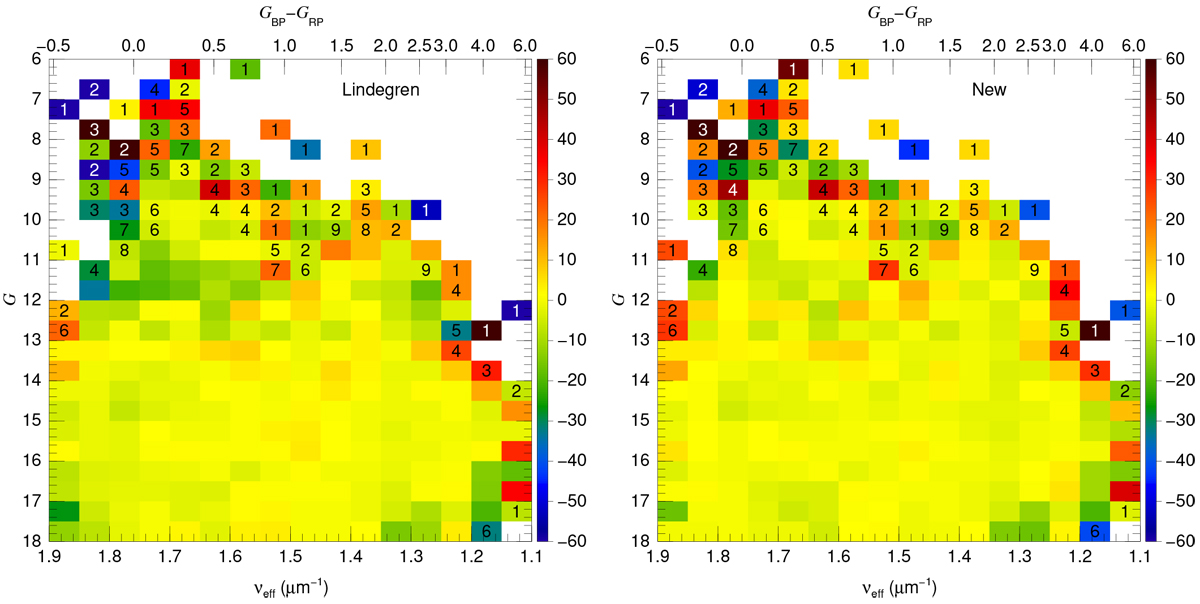
Average residual as a function of νeff and G using the Lindegren zero point (left) and the one proposed here (right) for the full sample. The left bar shows the scale in μas. Each cell hasa size of 0.05 μm−1 × 0.5 mag. Cells with less than ten objects used to calculate the average include the number of objects. The color scale is capped for values above 60 μas or below −60 μas for display purposes but some cells (seven in the left panel, and four in the right panel) are outside that range. The upper x axes use Eq. (4) of L21a to transform from νeff to GBP − GRP.
Current usage metrics show cumulative count of Article Views (full-text article views including HTML views, PDF and ePub downloads, according to the available data) and Abstracts Views on Vision4Press platform.
Data correspond to usage on the plateform after 2015. The current usage metrics is available 48-96 hours after online publication and is updated daily on week days.
Initial download of the metrics may take a while.