Fig. 5
Download original image
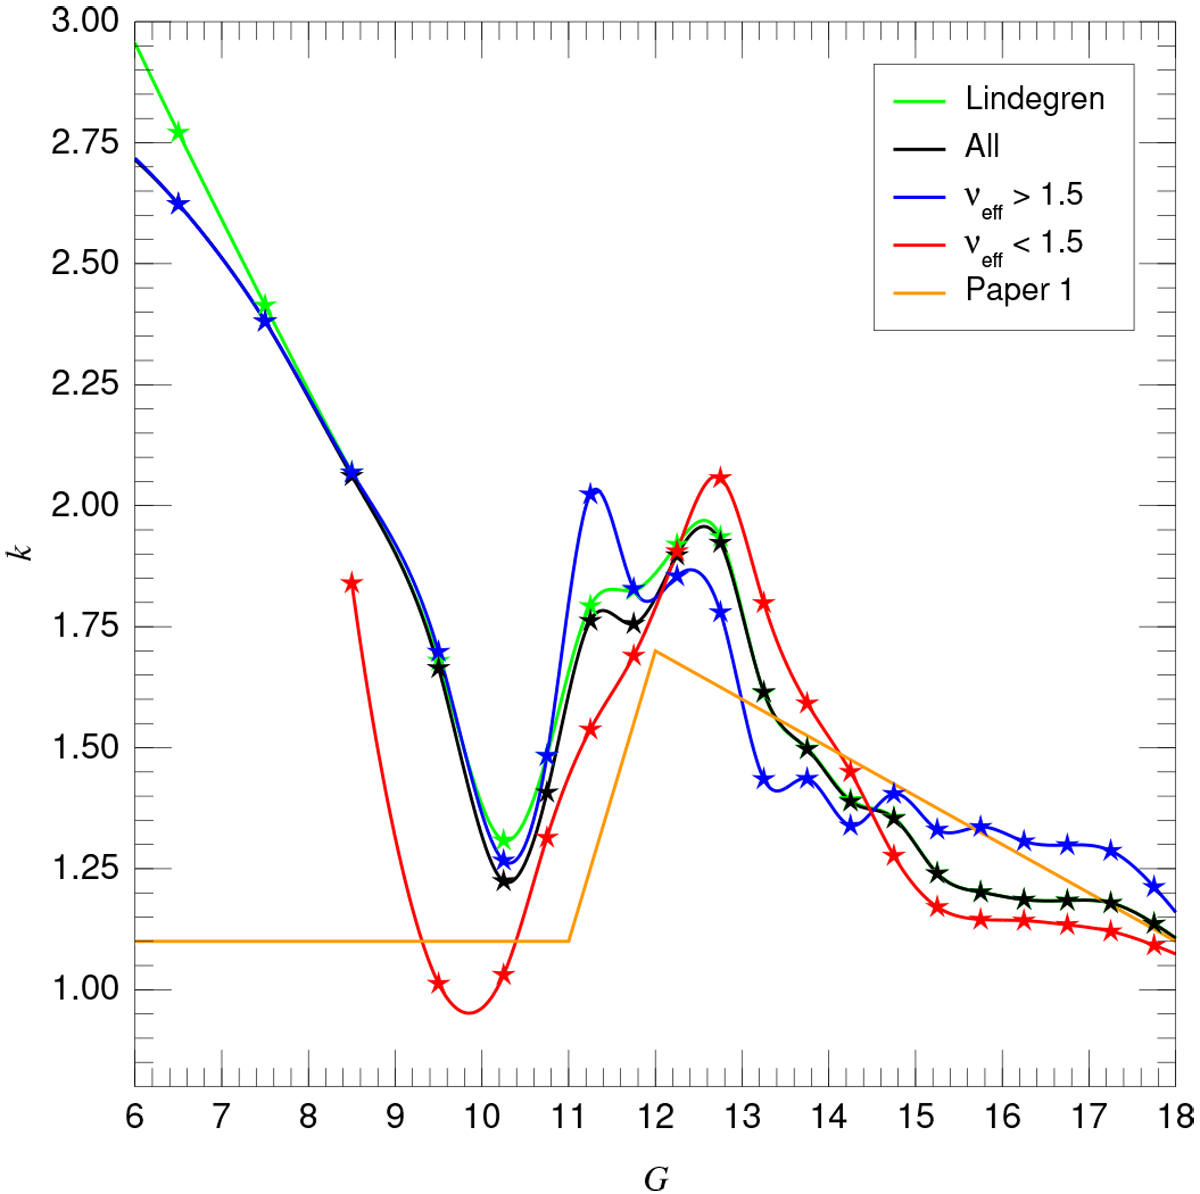
k as a function of magnitude for all colors using the Lindegren zero point (Table 2) and for the three cases in Table 5 using the results in this paper. The data points are calculated at 1 mag intervals for G < 10 and at 0.5 mag intervals for G > 10 and joined by a spline. The orange line shows the approximation derived in Paper 1.
Current usage metrics show cumulative count of Article Views (full-text article views including HTML views, PDF and ePub downloads, according to the available data) and Abstracts Views on Vision4Press platform.
Data correspond to usage on the plateform after 2015. The current usage metrics is available 48-96 hours after online publication and is updated daily on week days.
Initial download of the metrics may take a while.