Fig. 4
Download original image
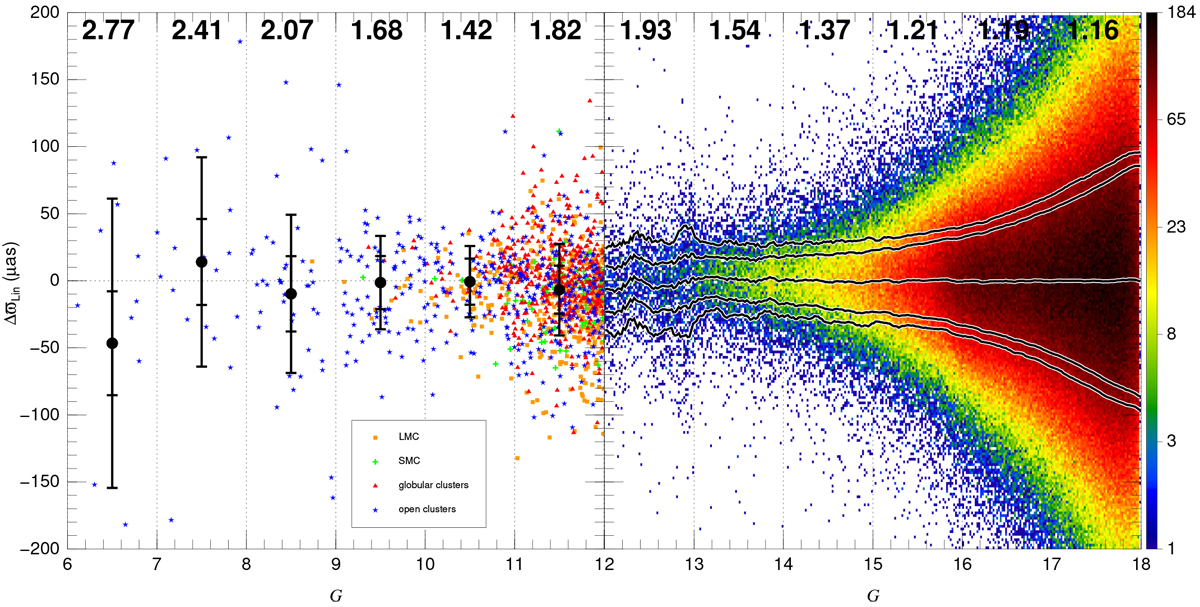
Residuals using the Lindegren zero point, ΔϖLin, as a functionof G. The plotis divided into two panels due to the differences in the sample sizes for stars with G between 6 and 12 mag (left panel) and stars with G between 12 and 18 mag (right panel). In the left panel all stars are plotted individually with a color+symbol code used to differentiate between the four samples used in this paper. In the right panel the stellar density is plotted combining all objects and using a logarithmic color scale, with the bar at the left indicating the number of objects in each 0.02 mag × 2 μas cell. The black points in the left panel show the average ΔϖLin in each magnitude bin. The error bars show the average of the parallax uncertainties (small values) and the dispersion of ΔϖLin (large values), also in each magnitude bin. In the right panel the points and error bars are substituted by lines displaying the same information. The text at the top of the panels gives the value of k in each magnitude bin as determined from the dispersion of ΔϖLin and the average parallax uncertainty.
Current usage metrics show cumulative count of Article Views (full-text article views including HTML views, PDF and ePub downloads, according to the available data) and Abstracts Views on Vision4Press platform.
Data correspond to usage on the plateform after 2015. The current usage metrics is available 48-96 hours after online publication and is updated daily on week days.
Initial download of the metrics may take a while.