Fig. 2
Download original image
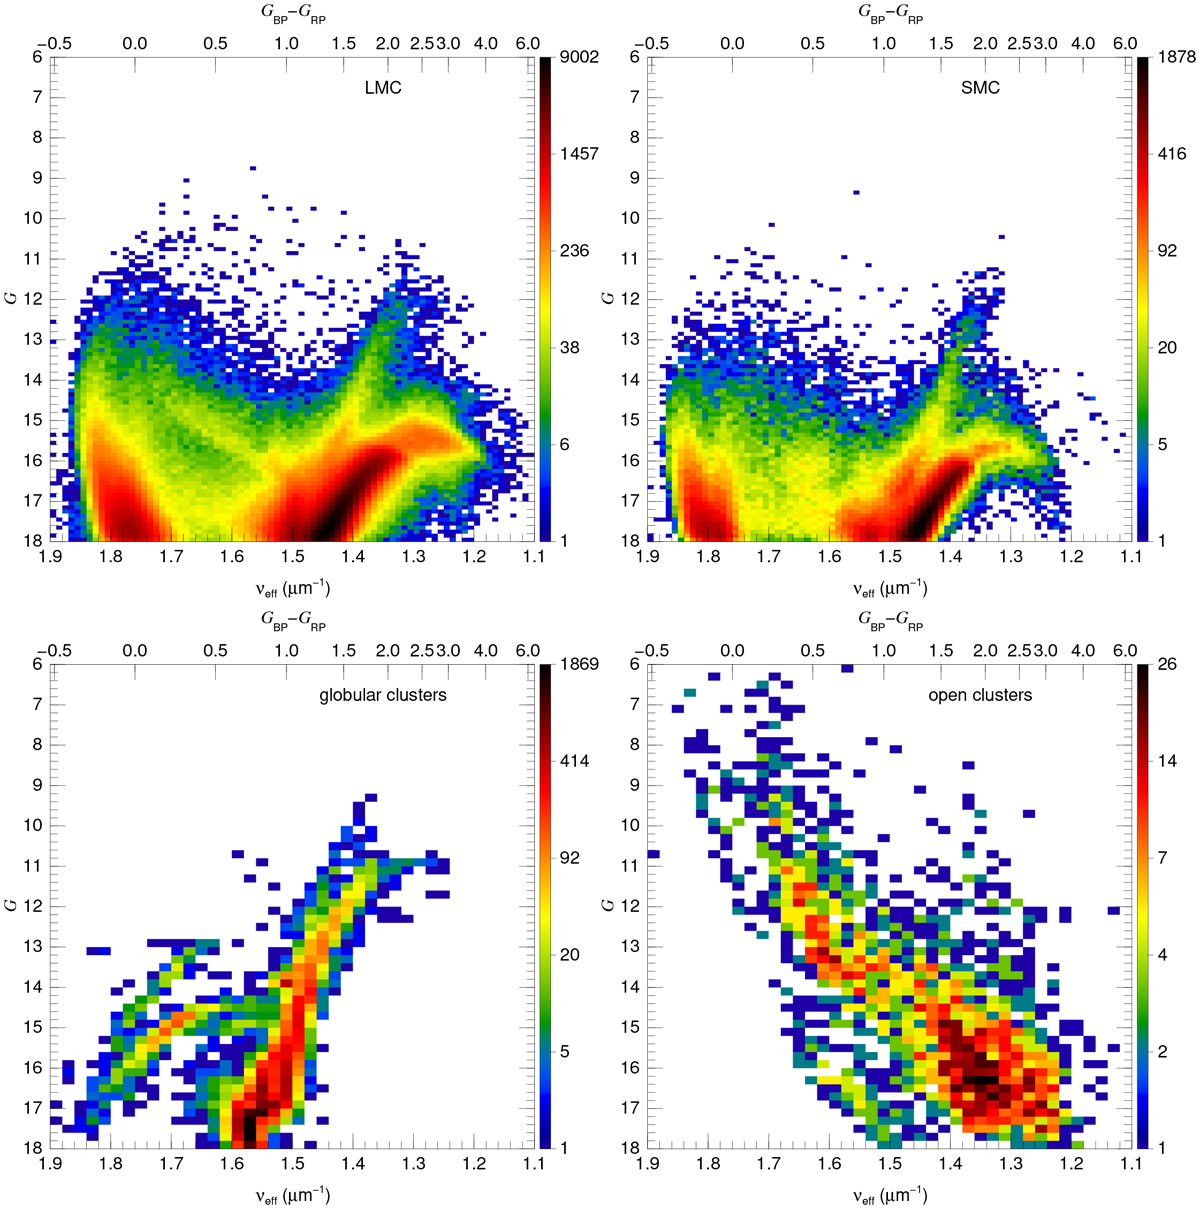
CMDs for the LMC (upper left), SMC (upper right), globular cluster (lower left), and open cluster (lower right) samples. The intensity scale is logarithmic and the cell sizes are 0.01 μm−1 × 0.1 mag (upper panels) and 0.02 μm−1 × 0.2 mag (lower panels). The color bars at the right of each plot give the number of stars per cell, I note that they are very different from panel to panel. The upper x axes use Eq. (4) of L21a to transform from νeff to GBP − GRP.
Current usage metrics show cumulative count of Article Views (full-text article views including HTML views, PDF and ePub downloads, according to the available data) and Abstracts Views on Vision4Press platform.
Data correspond to usage on the plateform after 2015. The current usage metrics is available 48-96 hours after online publication and is updated daily on week days.
Initial download of the metrics may take a while.